HINDUSTAN OIL EXPLORATION at Best Support !!This is daily chart of HINDUSTAN OIL EXPLORATION .
HINDOILEXP having a good Support zone at 162-165 level.
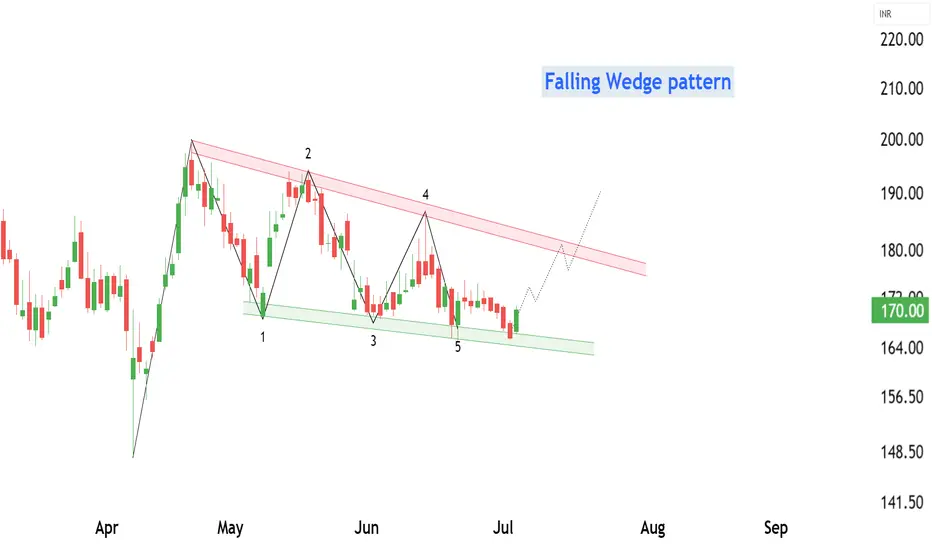
HINDOILEXP has formed a Falling Wedge Pattern with Support near at 165 level.
If this level is sustain , then we may see higher prices in HINDOILEXP .
Thank You !!
HINDOILEXP trade ideas
HINDOILEXP cmp 241.this stock trading at super positional level breakout.add this to your wachlist and study.

HINDUSTAN OIL EXP GIVES BRAKEOUT ON DAILY CHARTNSE:HINDOILEXP
I am buying this stock
Near 230
And follow sl on 200
My target will be 280
My risk reward ratio is 1:1.50
Return on capital 20%"

HINDUSTAN OIL EXP GIVES BRAKEOUT ON DAILY CHARTNSE:HINDOILEXP
I am buying this stock
Near 230
And follow sl on 200
My target will be 280
My risk reward ratio is 1:1.50
Return on capital 20%"

hindustan oil --buyready to breakout .positive divergence in weekly chart giving imputus to chart and a rally might fructify soon as near to breakout target of 3rd wave 387 . buy on every dip.

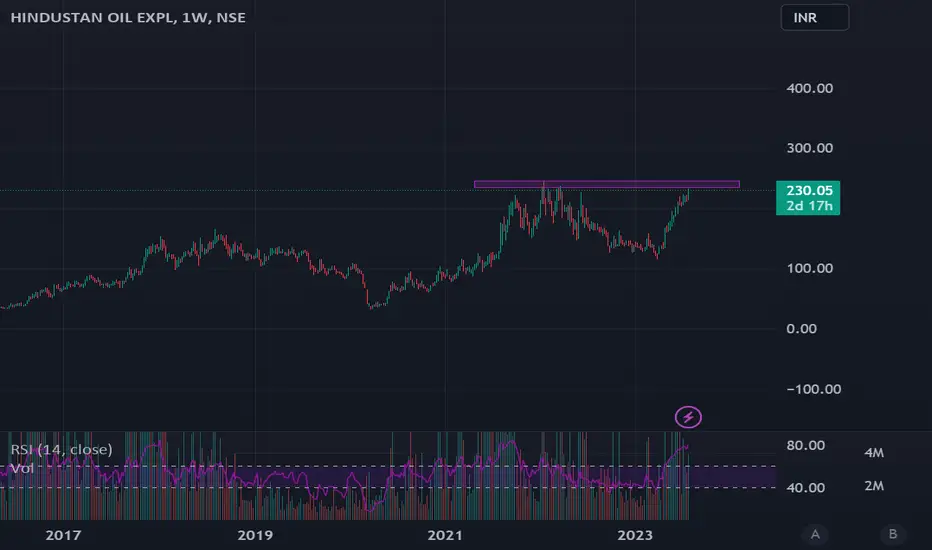
Multi year break out in hindoilMulti year break out in hindoil above 245
Keep a watch coming days on how the price moves. A strong day closing above 211 will be a good sign.
Target 300/360
S/L Closing below !75 Closing Basis
This idea is for Educational Purpose Only.
Learn & Earn,
LETS GROW TOGETHER
Faisal Merchant
I am not SEBI registered and all Ideas posted by me are for Educational Purpose.

Hindoil explorationConsolidation observed.
Volume contraction .
Pre entry Is good before it breakout.
Spending time near to resistance.
Once breakout 200+ will b target.

HINDOILEXPNSE:HINDOILEXP
Buy above 186
Support placed at 180-181
Sl- 175-176
Target- 193/204/218+
Rsi>60
Last two day trading volume is good and above avg
MA cross over 200/20

Analysis of HINDOILEXP1. Support at Rising Trendline:
The candle on the weekly chart indicates that the stock has found support at a rising trendline. This is a positive signal, suggesting that buyers are stepping in at this level, potentially indicating a reversal or a continuation of the upward trend.
2. RSI Signals:
The Relative Strength Index (RSI) is showing good support and positive divergence. This suggests that despite price movements, there is underlying strength, and the stock might have the potential for an upward move.
Proposed Trade Strategy:
Entry: Considering a long position at the current market price (CMP) of 169, based on the support from the rising trendline and the positive RSI indications.
Stop Loss (SL): Implementing a stop loss at 155 can serve as a safeguard against adverse price movements and potential losses.
Target: A target price of 182 is suggested. This target aligns with the bullish signals identified from the rising trendline support and the positive RSI divergence.
Conclusion:
The technical analysis suggests a bullish outlook for HINDOILEXP based on the candle finding support at the rising trendline and the RSI showing positive divergence.
As always, exercise caution and conduct thorough research before making any investment decisions. Markets are subject to change, and it's advisable to employ risk management strategies and seek guidance from a financial advisor.

Short Term Bullish View Short Term Bullish View on Hindustan Oil
Educational Purpose Only
1 Month Duration

Hindustan Oil Exploration bouncing from channel bottom.Hindustan Oil Exploration company is into drilling and exploration of Oil. It was the First company in India to drill 2 subsea well heads using Tree installation technique using jack-up rigs. Market cap of the company is Rs.2327Crores. CMP of the stock is 178.
Negative aspects of the company are Mutual funds decreasing stake and fall in net profit margins as well as fluctuations in Crude due to ongoing crisis in the Middle East. Positive aspects of the company are strong EPS growth. Reasonable Pricing (PE of the stock is around 10). Low debt and FIIs increasing stake in the company. Entry after closing above 185. Targets in the stock will be 196, 205 and 211. Long term targets in the stock will be 250+. Stop loss in the stock should be maintained at closing below 155.
The above information is provided for educational purpose, analysis and paper trading only. Please don't treat this as a buy or sell recommendation for the stock. We will not be responsible for any Profit or loss that may occur due to any financial decision taken based on any data provided in this message.

Clean Breakout Stock Hindustan Oil Exploration is a stock that has been showing signs of a breakout. The stock has been in an uptrend for the past few months, and it has recently broken out above a key resistance level. This is a bullish signal, and it suggests that the stock is likely to continue to rise in the near future.
We need to keep a few scripts in radars and focus on taking position carefully with Stop loss on the chart.
Happy trading.

triangle pattern breakoutPlease look into the chart for a detailed understanding.
Consider these for short-term & swing trades with 2% profit.
For BTST trades consider booking
target for 1% - 2%
For long-term trades look out for resistance drawn above closing.
Please consider these ideas for educational purpose

Hindoilexp- Nice breakoutHindoilexp- Nice breakout.
Capital to be deployed- 20k
Price -205
Stoploss-169
Targets -267/517
#hindoilexp #nifty50 #NiftyBank #investment #StockMarket #StocksToBuy

HINDoil WAS IN ASCENDING TRANGLE WAS BULLISHEbe ready for buying bullish and i have mark level on chart comment me for stocks analysis

HINDOILEXP BREKING OUT AFTER CONSOLIDATIONHINDOILEXP consolidated after bouncing on previous support and trying to breakup on high volume.

HINDOIL EXP (209) Can be a Good bet for Med-Long termHINDOIL EXP (209) chart looks strong - this could be a Good bet for Med-Long term as it's heading to 400++ levels
Do your own research before investing.

HindolexStock Hindolexp
Entry: 219
Analysis: Cup and handle formation
Wide range bullish candles are seen with volumes spike


Bullish HINDOILEXPBuy = 193.05
Stop Loss = 171.25
Target 1 = 236.65
Target 2 = 258.45
9sep2021
Bullish HINDOILEXP Hindustan Oil Exploration ltd
Buy for short term


