3 months holdingHINDPETRO made inverse head & shoulder pattern on WEEKLY charts with above average volume.
Could b bought in cash & hold for 2-3 months for target of 540.
Note: These are future levels,adjust it in cash levels.
HINDPETRO1! trade ideas

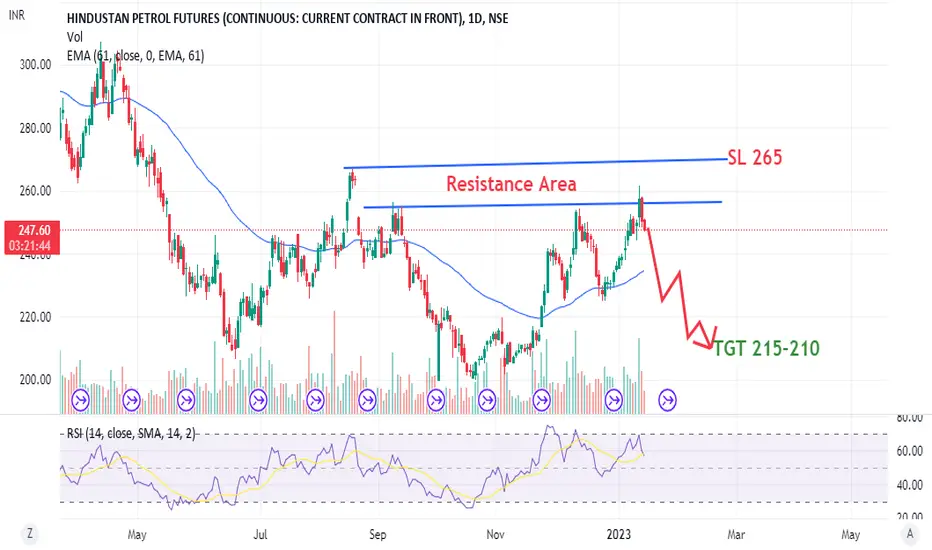
Future Trade: Bearish pattern seen in HPCLHPCL is reversing from almost triple top and RSI showing continuous negative divergence and is expected to turn bearish as seen on the daily time frame charts. A bearish engulfing candle pattern formation, having the open and high almost the same can be seen. Futures data also show a short buildup. A short trade can be taken in futures ( prices here given are as per spot) if the price sustains below 247 (preferred an equal lot hedge of 450 call option (25th January expiry) premium approximate 5-6(buy as hedge) along with short trade). It is giving an indication of the price falling at least up to 225 and below that, it can further fall to 215 - 210. Stop-loss is above 265 on a daily close basis. Close the shorts and hedge together. The holding duration is 3-4 trading sessions. This call becomes invalid if it opens below the 265 spot price.
PLEASE LIKE AND FOLLOW FOR FUTURE UPDATE.
HINDPETRO1!29-11
Daily chart of HINDPETRO1!
LTP: 238.85
The long term trends (manual and 200 EMA) are bearish.
RSI is overbought and signals a bearish reversal.
Supports are at 241.50 (200 EMA) and 237.05 (manual)
Strong support zone is between 200 and 207 so it may not be broken.
I think we will witness a profit booking if the candles do not breach 241.50 with strength.
I have gone short with a very strict stoploss for targets of 220 and 210.

HINDPETRO1!27-11
daily chart of Hind Petro
manual trendline and 200 EMA are bearish
RSI heading towards the overbought zone
Resistance at 237 (manual) and 241 (200 EMA)
Wait for RSI to get in the overbought zone & or price to come up to 238 / 240 and go short
