HINDUNILVR trade ideas


Hinduni { Long 30 M }Hammer in formation at support , Long if break . Rest is as per charts
Note :-
Entry - At the break of mentioned candle's low/high
Stop Loss -
In a Short Trade, I always use Previous Candle High ( PCH ) as a stop loss while entering the trade. Sometime I might use 15 M tf SL & trade in 30M tf which I'll mention. Vice Versa for long trades
Trailing Stop Loss ( TSL ) - Mostly I trail stop loss by PCH as price falls . I exit as PCH breaks & vice versa
Use of PSAR as TSL :- TSL get's hit in trend following due to noise, In such cases I use PSAR to be in trend & exit if PSAR direction change
You can use any one of above mentioned or your own way to manage risk
Time Frame :- I take ~ 90% of my intraday trades in 15m tf. Where my analysis might come from higher frames like W , D or 1hr chart pattern which will be mentioned.
Target :- I do set target line based on support / resistance slightly above/ below it . Please pay attention to it


HINDUNILVR long way to goCurrent trends looks neutral for short term - observe for a week, already hit support line. Looking at financial report looking strong but PAT growth is 4% rise in Sept 2020 compared to 25.28% rise in Jun 2020. So better to keep in watch list for good news and long investment.

UNILEVER On good support point can we see what I See ?It is a VERY GOOD R:R ratio trade a good reaction created at current price marking bullish nature can extend the rally to upper black line.

Lever of Market"This is my trading journal, not a trade recommendation. I Will be Posting and updating the ideas regularly, as market progresses, only for educational purposes for me and others who want to benifit from my experince.
DISCLAIMER:
Trading in the stocks market or futures markets is on e of the riskiest forms of investments available in the financial markets and suitable for sophisticated individuals and institutions. The possibility exists that you could sustain a substantial loss of funds and therefore you should not invest money that you cannot afford to lose. Nothing in this analysis is a recommendation to buy or sell stocks or futures and I shall not be liable for any loss or damage, including without limitation, any loss of profit, which may arise directly or indirectly from the use of this analysis or reliance on such information. Consult your financial advisor prior to investing is stock market.
This is one person’s experience, your experience may differ. Past perfomance is not gaurantee of future gains.

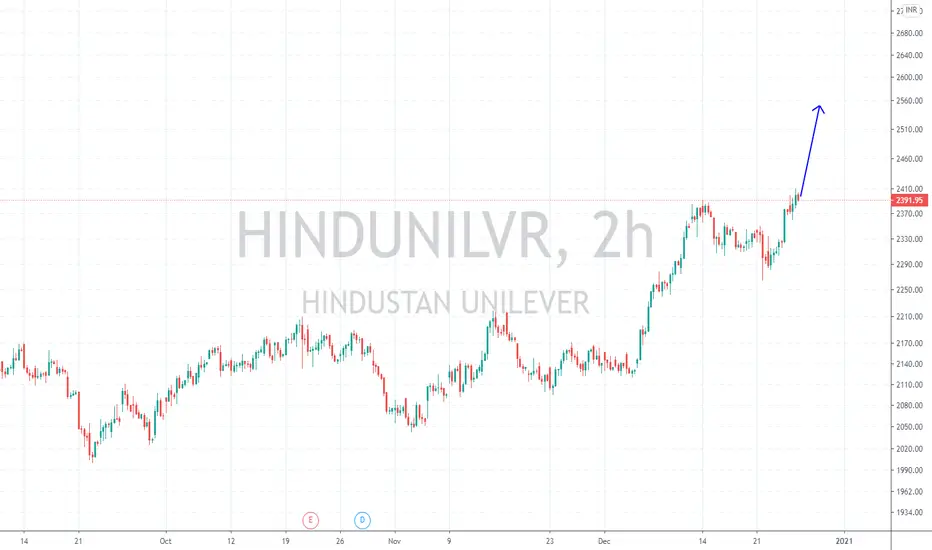
Hindunilvr - Intraday / Swing Trade SetupHindunilvr CMP - 2404.25
Looking bullish in higher time frame. One can go for Intraday / Swing Trade setup with the following entry, exit & targets
Buy at or Above 2413 - 2415 / Stop Loss 2400
Target 1 - 2424
Target 2 - 2430
Target 3 – 2435 / 2440
Swing Target - 2550 - 2600 / Stop Loss 2260
Disclaimer: This is my view and for educational purpose only.

Failed double top breakout in Hindustan Unilever Go short if open flat or almost flat and cross level


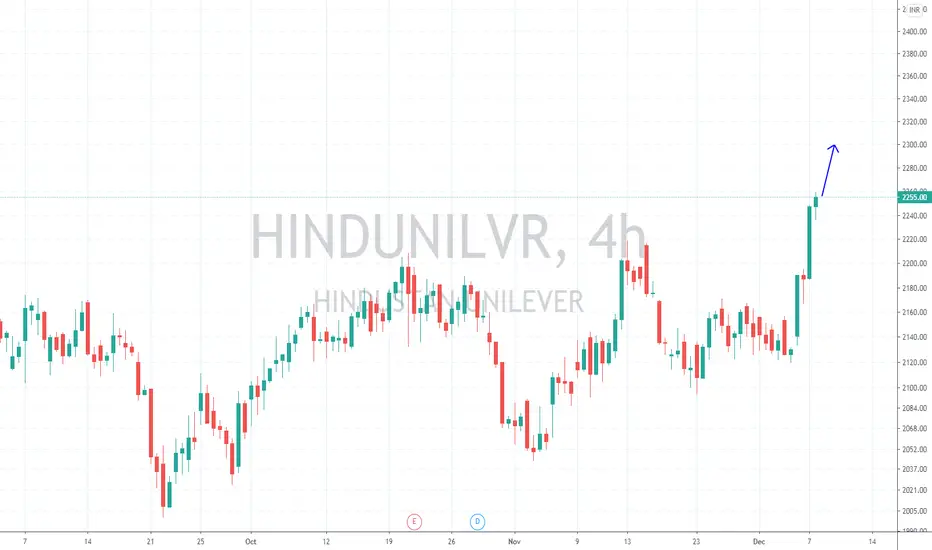
Hindunilvr - LongHindunilvr CMP - 2256.15
Looking bullish and range breakout in higher time frame. One can go for Intraday / Swing Trade setup with the following entry, exit & targets
Buy At or Above 2257 / Stop Loss 2244
Target 1 - 2267
Target 2 - 2277
Target 3 - 2288 / 2300
Disclaimer: This is my view and for educational purpose only.
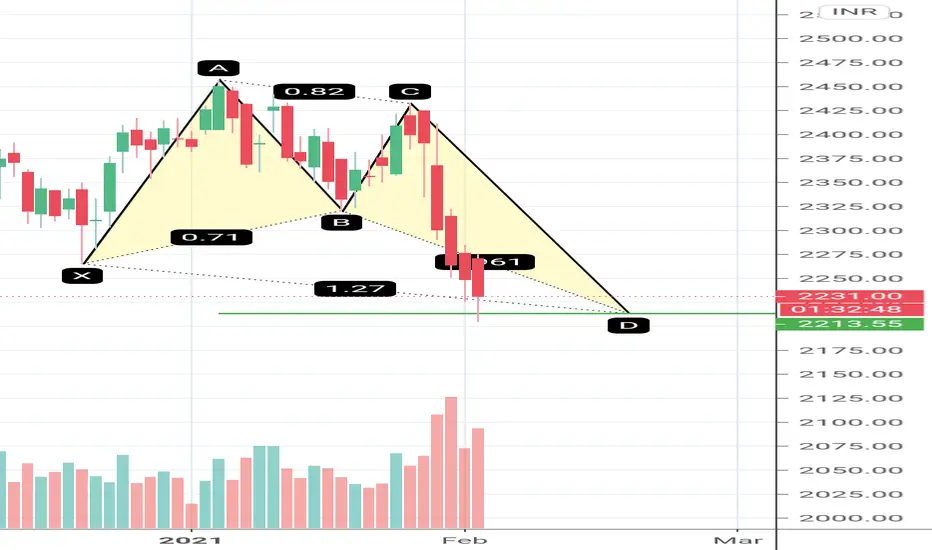
Hindunilvr - Bearish CrabHindunilvr has bearish crab on 4hr TF , Volume not supporting upmove. Short from PRZ . Targets on chart...


Go short if open flat or almost flat and cross level Go short if open flat or almost flat and cross level

HUL Bullish CMP 2185HUL- CMP 2184. 20EMA crossed 50EMA just recently and it gained bullish momentum. MACD crossover done on last trading session it entered positive territory which is positive. RSI also crossed resistance zone and shall go up. Can be taken with SL of 2115 for a target of 2220, 2328, 2388, 2495. General momentum presently in FMCG sector also will be another factor for taking longs in the counter. For educational purpose only can take experts opinion before investment.


HUL Bullish CMP 2166HUL has turned bullish. Its RSI is in raising trend giving buying indication. It is trading above recent highs. Shall go up in short term f market does not fall badly.


