HINDUNILVR trade ideas

Small pullback or consolidation to break the resistanceReady to break and make take time correction and little price correction to break the resistance.

Buy HUL for new up journeyAs you can see price is trading near to the bottom of the bands and also near strong support zone we can expect rally soon in HUL good luck


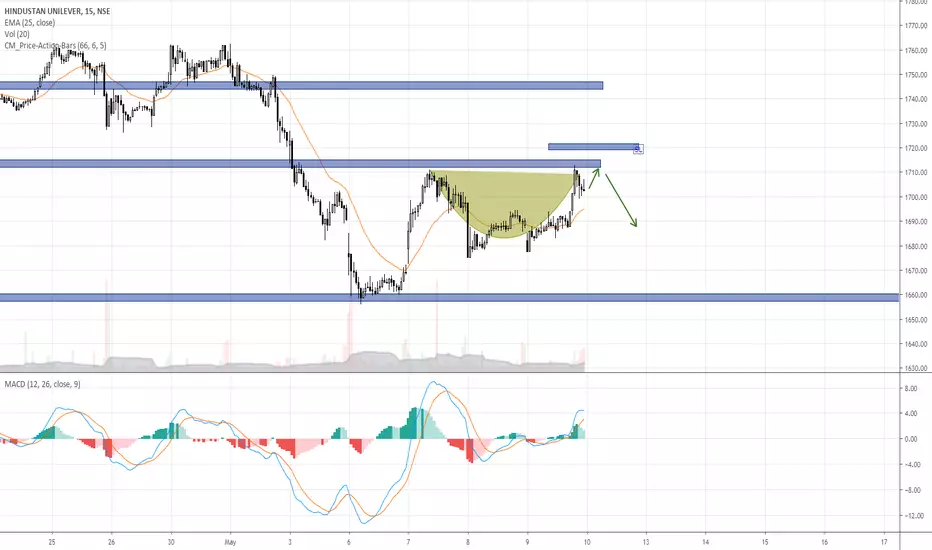
Hinduunilvr Wave Analysis(Bullish)#HINDUNILVR 3 wave correction complete
C wave ending diagonal completed at 1663 and a break out of this falling wedge is a buy signal and shud be 5 wave impulse up for new life highs
RSI formed a double bottom and a bullish divergence with stoch cross over #nifty50 #niftfuture

HINDUSTAN UNILEVER - RESTING ON SUPPORTHUL
CMP 1684
Stop 1600
Long suggested at around 1690 plus.
Logic:
Stock resting on long term upward trend line.
Stock resting on 40 wks ema (200 day ema) with tight price action.
Appearing to be a good setup with a favourable risk reward with a possible target of 1875 plus.

Just learning..... Seen down trend in price movement, and RSI peak are at same level.... Is it a sign of turn around?


HUL @ SupportIf this support breaks it could touch the long term support line as well as the 200EMA.

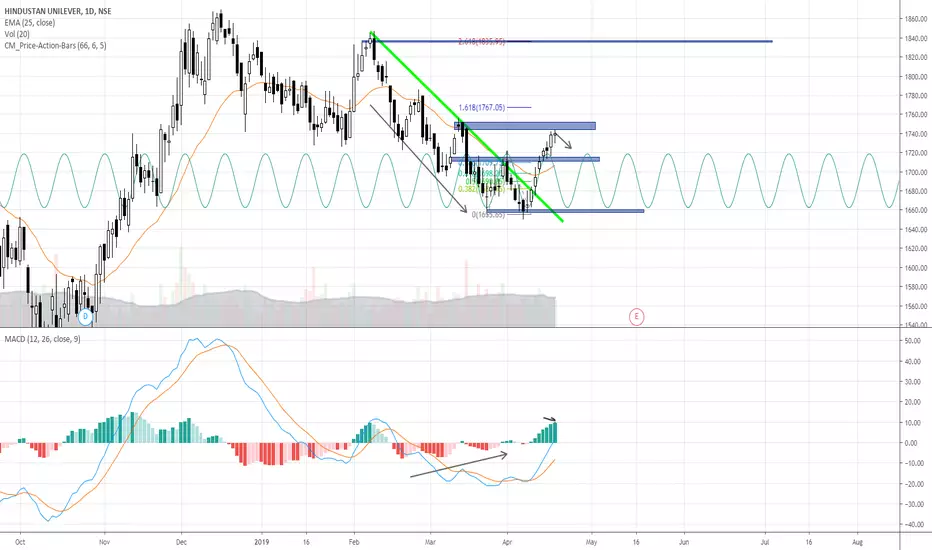
Creating a descending triangleIf the descending triangle breaks to the down.
Target 1 is 0.5 fib level.
It can go to 0.618 level with a wick.
The long term trendline can act as a support.

HUL Respecting the descending triangle pattern. SHORTAs indicated, the HUL is respecting the descending triangle pattern. If the script close below 1740 today, there is a breakout .
Expecting to consolidate until 1610 rupees.


Is HUL going towards 1300??Hi
There is Bearish divergence in HUL weekly chart
and if it breaks the support blue line, will it go all the way to 1300??
Long investors be cautious
Regards


Hindustan Unilever is set to fall after this Bearish divergence?Hey Friends,
Trading Mantra:
“An astute trader aims to enter the market during quiet times and take profits during wild times.” ― Alexander Elder,
According to J. Welles Wilder, the person who developed the Relative Strength Index, When the stock price and the directional momentum does not match each other, is called as Divergence. There are two types of divergence, a Bullish divergence and a Bearish Divergence.
Bullish Divergence occurs when the stock price makes lower low and RSI makes higher low, in other words the RSI resists to make a lower low despite the stock price making a lower low.
Bearish Divergence occurs when the stock price makes higher high and the RSI makes a lower high, in other words the RSI resists to make a higher high despite the stock price hitting the higher highs.
HINDUNILEVER | SELL | Price : 1830-1850 | Stop Loss 1864 | Target 1722, 1674
Observations on the Chart:
The stock made a low of 1478 on 11th Oct 2018 See point V1 low 1478 (blue vertical line) & a high of 1869 on 17th Dec 2018 see point V2 high (red vertical line)
Stock has been inching upwards with the blue trend line, which the stock has breached on friday 21st dec 2018
If we connect the highs of point A & point B we get an upward sloping line AB
if we connect the highs of the RSI at point C & D we get a downward sloping line CD
There is good amount of divergence on the price and the RSI indicator the price was making newer high at point B as compared to point A and the RSI was making lower high at point D as compared to point C
This is hinting towards a BEARISH DIVERGECE and the stock may fall to 1722 & 1674 in coming month.
One can take a short position around 1830 to 1850 with a strict stop loss of 1864
Isn’t it amazing ? ? ?
Billion Dollar Question to ask yourself
Are you finding any such patterns if not how to find them ?
Thank you for sharing….
Happy reading…
Happy Trading…
Be a Wealthy Trader…..

Crucial SupportStock is at crucial support ,hard to break as tried multiple times but if breakouts out below 1800 then can give a some nice points on intraday as well positional basis,with previous days HIGH AS SL ..
......................SL is little wide so that should be kept in minded before executing trade......

Resistance breakoutDear Traders,
It is a good opportunity to go long in Hindustan Unilever Ltd. The upper resistance breakout is triggered at 1808.75 and the Vertical Target is at 2070.
There is a high probability of reaching vertical target. There is a clear confirmation from MACD which is above the signal line and is bullish.
