HINDUNILVR trade ideas

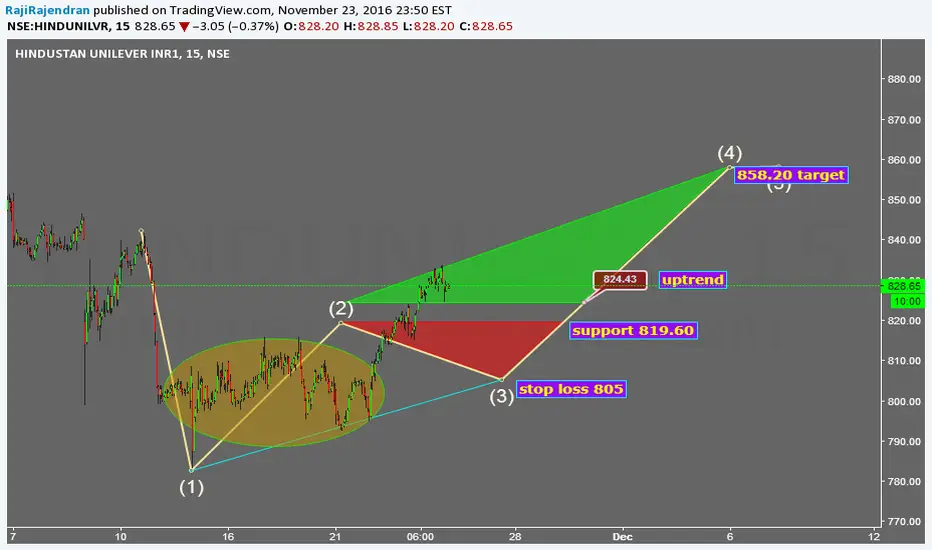
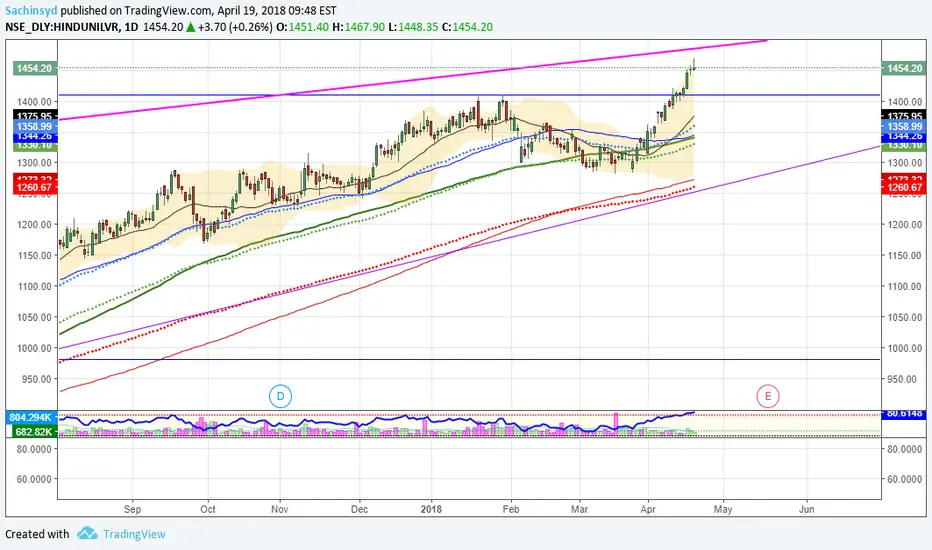
Hindustan Unilever - Bullish to Wave 5Hindustan Unilever seems to have finished Wave 4. Now there is a definite bullish bias....

HUL, BreakoutBroke out on the expected lines. Covering this consistently. Now 1711 is the resistance. New highs are expected. It may take time since traders will book profit.

HUL, ConsolidationPost big leap in price, consolidating. A breakout, whenever it may come will take the price to new levels.

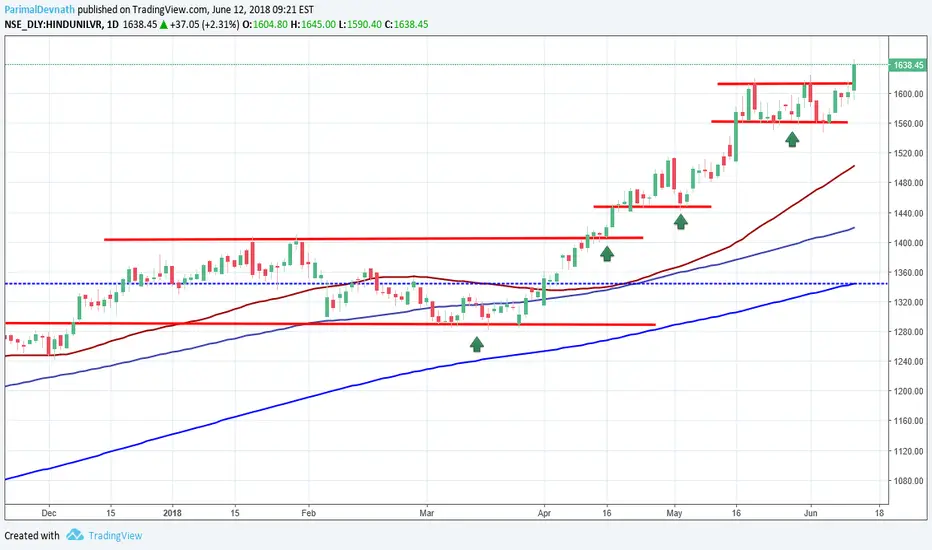
HUL, BreakoutI covered this stock many times with the expectation of a breakout and today the same has occurred. Now staying above 1623 (the breakout point) price may make brisk upmove. Crossing and holding above 1643, price may be pushed towards 1706 in near future. I am slightly concerned about the Negative Divergence. Else, good move may be in the offing. Good stock and good industry segment. Good monsoon forecast may boost confidence of the bulls.
HUL, ConsolidationPosted this chart many times. Breakout is yet to happen. When price breaks out of the rectangular narrow range, it will be similar to that of Infy.

HUL Weekly SetupHul has given stron results in this quarter. Company is fundamentally strong.I Will wait for Buy at given levels. More correction is expected which is taken as opportunity to buy.

HUL, ConsolidationAfter a big rise, price is in consolidating in a box. OI resistance has been at 1600 and 1645. So correction is happening from resistance level and support lies at 1490 to 1610. We recommend going long at support zone with a small SL.
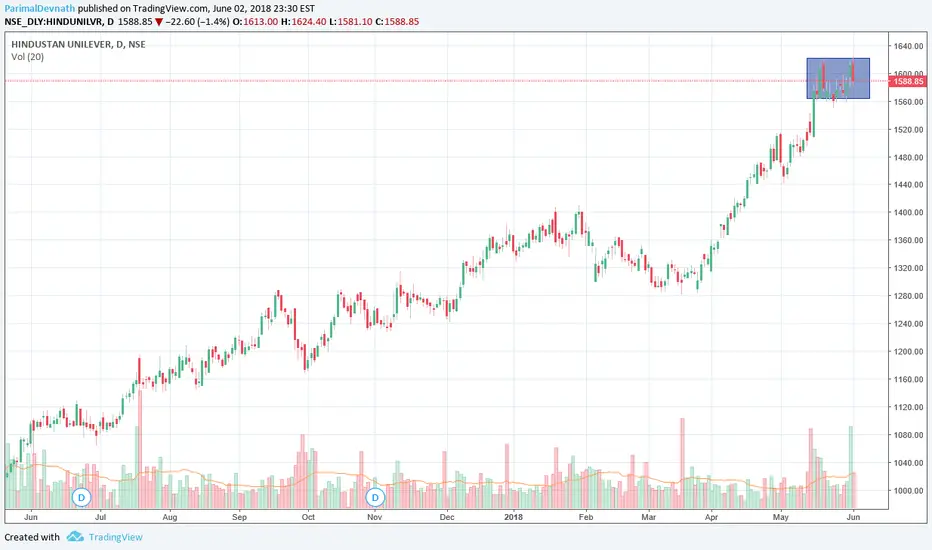
HUL, BreakoutA breakout chart in strong bullish phase. Now the marked range -- 1559 (support) to 1604 (resistance) is crucial. Expect one more breakout above the immediate resistance zone short term target of which could be 1640 to 1680.


Hindunilvr, BreakoutProtecting 1400 --the previous top, this stock will be a big thing for coming months as the expected breakout is anything to go by. The stock is in strong bull market, a premium stock.

HINDUNILVR v close to a major highHINDUNILVR v close to a major high .. build shorts until 1500 target atleast 1300
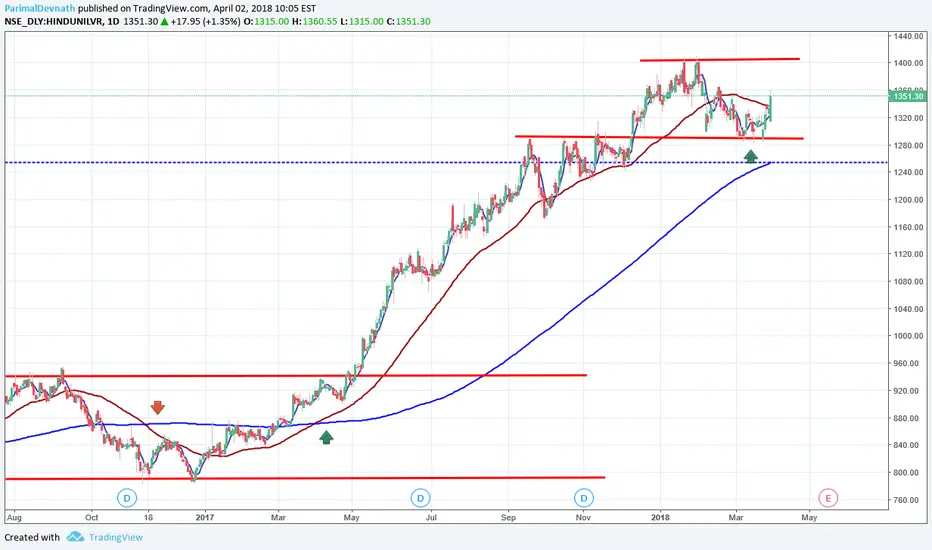
HindUnilvr, S&RPlease refer to earlier post on this stock. Support and Resistance: These levels of Support and Resistance is to decide the bullish momentum remaining intact in near term.
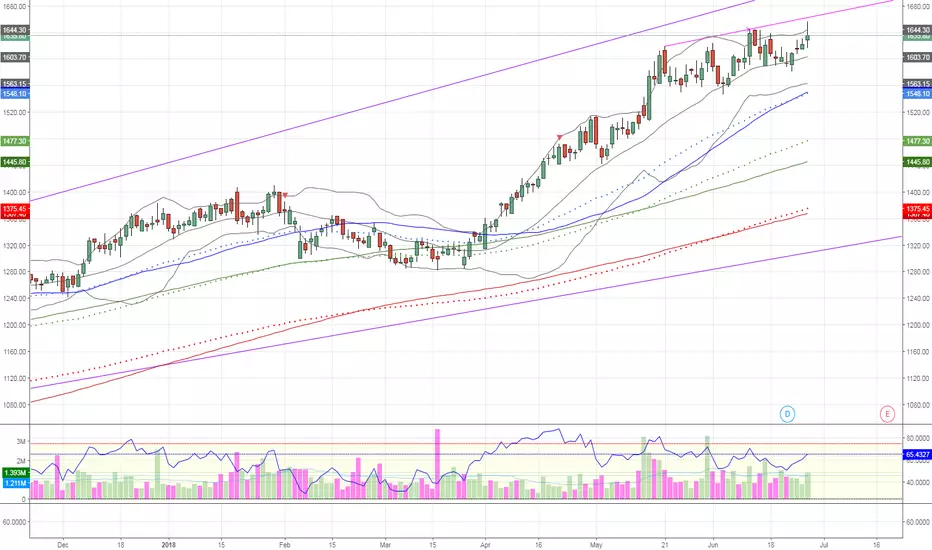
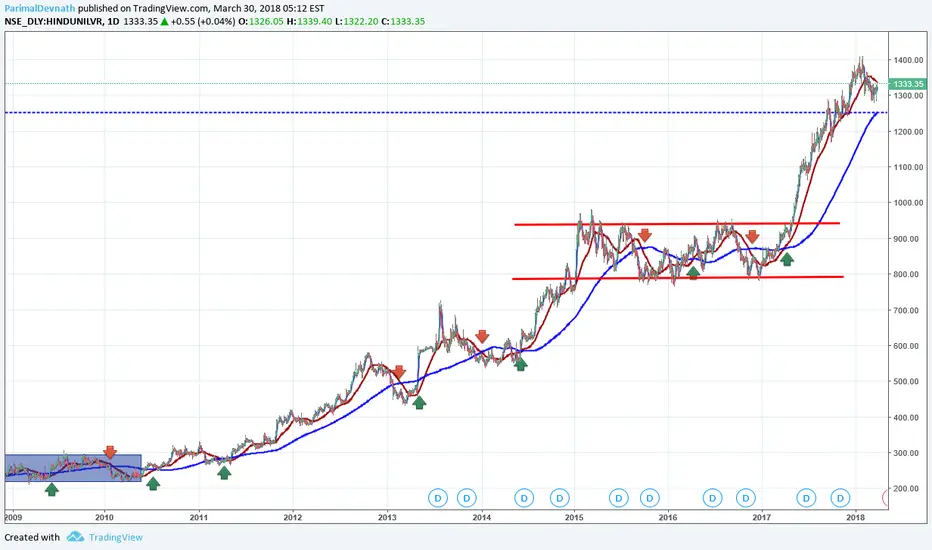
HUL, Golden CrossHindUnilever: I am studying 25 years chart of this stock to find unfolding of a great bullish trend. (Trading View provides chart from 2009 onwards). From 1997 to 2007 price consolidated in a narrow range. After 10 long years, a powerful breakout took the price to new heights till 2014. From 2014 to 2017 price again consolidated and then broke out once more.
Observations:
a) Negative cross of 50 DMA and 200 DMA could not cause serious harms. Rather bulls availed golden chances.
b) Positive cross of 50 DMA and 200 DMA always created great investment opportunities.
c) In January 2018 a negative divergence gave a correction to price but trend remained intact.
d) On 9th March 2018 a positive divergence heralded the end of this medium term correction.
If market favors, price can reach previous high at 1405, which is the immediate resistance.


Hindustan Unilever #HINDUNILVR Indian Stock buy setup at weeklyHindustan Unilever #HINDUNILVR Indian Stock buy setup at weekly demand level around 924.
Very strong departure. Previous weekly demand at 771 played out nicely

Hindustan Unilever inside a flag pattern!!Market analysis: The price is now trading inside a flag pattern, One the market breaks the flag we can enter a long entry. So lets wait and see what the market does in the coming days. Cheers!