Review and plan for 8th July 2025Nifty future and banknifty future analysis and intraday plan.
Swing ideas.
This video is for information/education purpose only. you are 100% responsible for any actions you take by reading/viewing this post.
please consult your financial advisor before taking any action.
----Vinaykumar hiremath, CMT
ICICIPRULI trade ideas

ICICI Prudential Life Insurance BuyICICI Prudential Life Insurance jumped back from its channel support. Also it break above its recent resistance line. Small return trade. Buy @CMP (648) with SL of 640 and target of 665 and 675. Long-term target is 730.

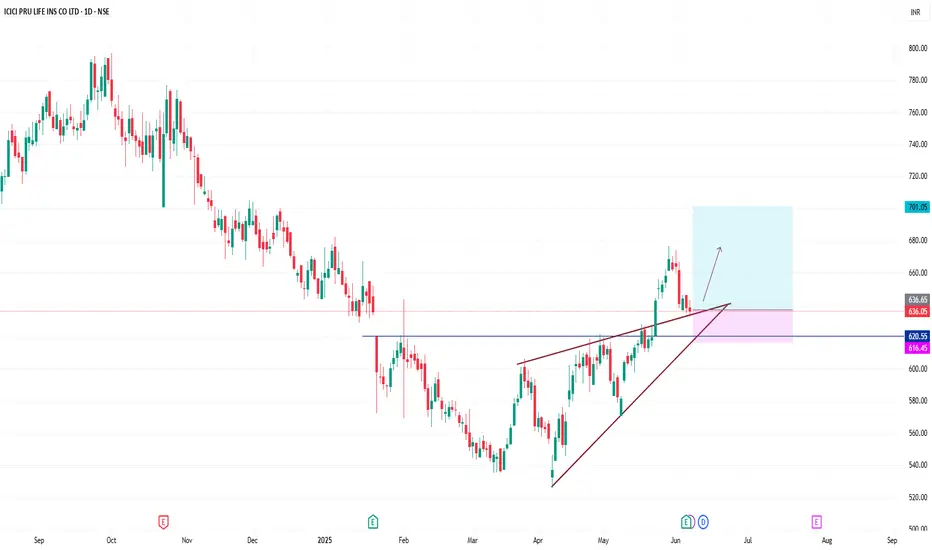
ICICI PRU LIFE INSDaily timeframe, its a swing trade, trendline breakout and retest, stoploss below 620 and target is 700, add your watchlist and observ this stock.
Reversal Trade in ICICI Prudential1. Consolidation breakout
2. Positive Divergence on RSI
3. Volume pop up
4. MACD signal turning green
5. RSI near 70
6. Good weekly close

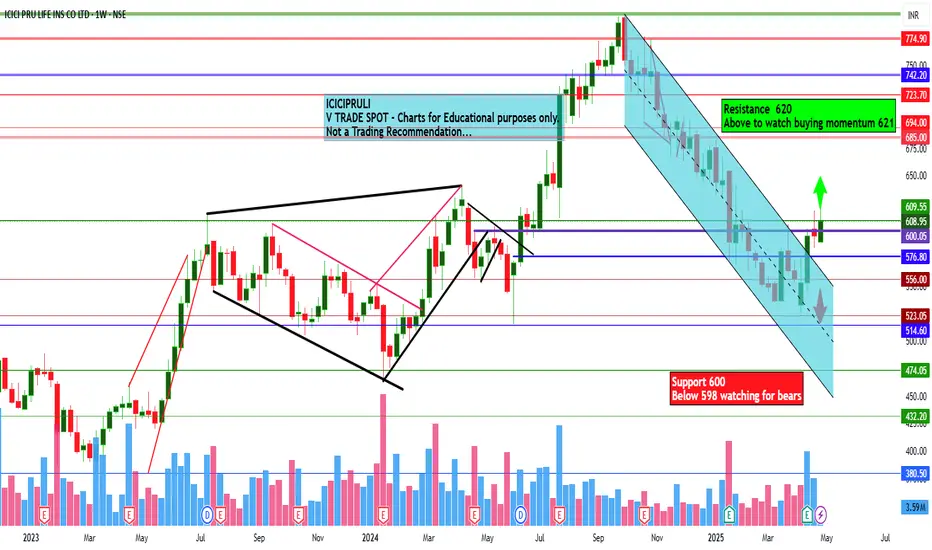
ICICI Prudential Life Insurance Co. Ltd view for Intraday 5th MaICICI Prudential Life Insurance Co. Ltd view for Intraday 5th May #ICICIPRULI RULI
Resistance 620-621 Watching above 621 for upside movement...
Support area 600 Below 610 ignoring upside momentum for intraday
Watching below 598 for downside movement...
Above 610 ignoring downside move for intraday
Charts for Educational purposes only.
Please follow strict stop loss and risk reward if you follow the level.
Thanks,
V Trade Point
ICICI Prudential Life Insurance Co. Ltd view for Intraday 2nd MaICICI Prudential Life Insurance Co. Ltd view for Intraday 2nd May #ICICIPRULI
Resistance 620-621 Watching above 621 for upside movement...
Support area 605 Below 615 ignoring upside momentum for intraday
Watching below 603 for downside movement...
Above 615 ignoring downside move for intraday
Charts for Educational purposes only.
Please follow strict stop loss and risk reward if you follow the level.
Thanks,
V Trade Point

ICICI Prudential Life – Turning the Corner?After months of steady decline inside a falling channel, ICICI Prudential Life is showing early signs of reversal. The stock has recently broken out of its channel with a strong bullish weekly candle, closing at ₹571.70 with a +4.5% gain. Volume is picking up, and RSI is curling up above 40 with a bullish divergence—indicating momentum is building. Price is now near a key resistance zone (~₹590–₹610); a clean breakout here could confirm trend reversal.
📊 Financial Snapshot
Net Premium Income: ₹10,169 Cr vs ₹9,465 Cr ⬆️
PAT: ₹226 Cr vs ₹221 Cr (flat YoY)
VNB Margin: Healthy at 26.7%
Embedded Value: ₹47,020 Cr
Solvency Ratio: Strong at 211%
AUM: ₹2.88 Lakh Cr
💡 Why Consider Buying?
Reversal setup after long correction
Attractive risk-reward near base
Steady premium growth, strong solvency
Long-term growth play on India’s underpenetrated life insurance sector
🚫 Risks / Why to Wait:
Resistance at ₹590–₹610 still intact
PAT growth has been flat
Sector sentiment can be sensitive to interest rate trends
🎯 Trade Setup:
Buy Zone: ₹565–575
Target 1: ₹610
Target 2: ₹660
Stop Loss: ₹540
for educational purposes only

ICICI Pru Life Insurance Spotted Around SupportICICI Pru Life has dropped over 30% from its recent high of 796 and is now trading near a strong support level. It’s moving within a parallel channel that has been in play since 2019. This channel can help identify potential mid-term and long-term targets for the stock.

ICICIPRULI looking good for UPMOVEICICIPRULI Have broken out of two Downtrends and coming up steadily with Volume. It can be averaged between 570-550 with
Strict stoploss at 530
TARGETS 650 680 & 730
CMP 576

ICICIPRULI Trading Above Fresh Demand ZoneICICIPRULI is currently trading at ₹673.6, above its fresh demand zone between ₹642.75 and ₹611.25, established on 24th July 2024. This untested zone suggests potential buying interest if the price revisits the range. Investors may monitor for a pullback to this zone to evaluate trading opportunities.
Disclaimer: This analysis is for informational purposes only and should not be considered as financial advice. Please conduct your own research or consult a financial advisor before making any investment or trading decisions.

Icici Pru life trading in bulish candle on golden zone Icici Pru trading in bulish candle on golden zone on weekly time frame it can fly from this level soon.

ICICIPRULI breakoutTarget mentioned on Chart
Disclaimer:- Please always consult with your financial advisor or do your analysis before taking trade

ICICI Prudential Life Insurance view for Intraday 3rd Dec #ICICIICICI Prudential Life Insurance view for Intraday 3rd Dec #ICICIPRULI
Resistance 695. Watching above 696 for upside movement...
Support area 690 Below 695 ignoring upside momentum for intraday
Support 690 Watching below 685 for downside movement...
Resistance area 695-700
Above 696 ignoring downside move for intraday
Charts for Educational purposes only.
Please follow strict stop loss and risk reward if you follow the level.
Thanks,
V Trade Point

ICICI Prudential Life Insurance Company view for Intraday 2nd DeICICI Prudential Life Insurance Company view for Intraday 2nd Dec #ICICIPRULI
Resistance 700. Watching above 705 for upside movement...
Support area 690 Below 696 ignoring upside momentum for intraday
Support 690 Watching below 689 for downside movement...
Resistance area 700
Above 696 ignoring downside move for intraday
Charts for Educational purposes only.
Please follow strict stop loss and risk reward if you follow the level.
Thanks,
V Trade Point

#ICICIPRULI WTF/MTF Range Breakout 3Y3M POSITIONAL ONLY
ICICIPRULI has a very Deep Bullish Channel Trend Cycle, Currently given the Bullish Sentiment after the Elections and Buoyant Outlook in the Budget in the Next Week.
Current Range of 3Years and 3months is 557 to 606
ICICIPRULI is a Good Buy above 615 With a SL of 590.
Add Quantity above 640 Hold for 1st TGT of 725 current ATH and 777, 840 thereafter

#ICICIPRULI NSE DTF/WTF/MTF Trend Line Breakout SWING /POSITIONAL
#ICICIPRULI NSE Results Due End of JULY 24 early August.
ICICIPRULI has made a W pattern on Daily Time Frame (DTF) with Neckline @606,
Resistance @ 615 if Closes above this on WTF Add quantity
Made a High of 640 breaking its pervious high of 613 and is currently on a Pullback in weekly Time Frame (WTF).
Support SL @ 550
Set Targets of 648 for Swing and 725 (20%) & 840 (39%) Positional

ICICI Prudential Insurance view for Intraday 19th Nov #ICICIPRULICICI Prudential Insurance view for Intraday 19th Nov #ICICIPRULI
Resistance 700. Watching above 702 for upside movement...
Support area 680 Below 690 ignoring upside momentum for intraday
Support 678-680 Watching below 677 for downside movement...
Resistance area 700
Above 690 ignoring downside move for intraday
Charts for Educational purposes only.
Please follow strict stop loss and risk reward if you follow the level.
Thanks,
V Trade Point

SWING TUTORIAL - ICICIPRULIIn this tutorial, we analyze the stock NSE:ICICIPRULI (ICICI Prudential Life Insurance Company Limited) identifying a lucrative swing trading opportunity following its all-time high in Sep 2021. The stock declined by nearly 50%, forming a Lower Low Price Action Pattern, but subsequently reversed its trend.
At the same time, we can also observe the MACD Level making a contradictory Pattern of Higher Lows. This Higher Low Pattern of the MACD signaled the start of a Bullish Momentum, thereby also signaling a good Buying Opportunity.
The trading strategy yielded approximately 88% returns in 71 weeks. Technical analysis concepts used included price action analysis, MACD, momentum reversal, trend analysis and chart patterns. The MACD crossover served as the Entry Point, with the stock rising to its Swing High Levels of 724 and serving as our Exit too.
As of wiring this tutorial, we can also notice how the stock is making a breakout and retest of the Swing High levels and trying to continue its momentum further upward trying to make a new All Time High.
KEY OBSERVATIONS:
1. Momentum Reversal: The stock's price action shifted from a bearish to a bullish trend, indicating a potential reversal.
2. MACD Indicator: The Moving Average Convergence Divergence (MACD) line showed steady upward momentum, signaling increasing bullish pressure.
3. MACD Crossover: The successful crossover in March 2023 confirmed the bullish trend, creating an entry opportunity.
TRADING STRATEGY AND RESULTS:
1. Entry Point: MACD crossover in March 2023.
2. Exit Point: Swing High Levels - 724.
3. Return: Approximately 88%.
4. Trade Duration: 71 weeks.
TECHNICAL ANALYSIS CONCEPTS USED:
1. Price Action Analysis
2. MACD (Moving Average Convergence Divergence)
3. Momentum Reversal
4. Trend Analysis
5. Chart Patterns
NOTE: This case study demonstrates the effectiveness of combining technical indicators to identify bullish momentum. By recognizing Price Action, MACD movements, and Reversal patterns, traders can pinpoint potential entry and exit points.
Would you like to explore more technical analysis concepts or case studies? Share your feedback and suggestions in the comments section below.

Icici prudential Icici pruli is standing above it's previous all time high swing and forming bullish candlestick pattern in times when nifty has corrected 6/7 percent.
Clearing a good long bet once nifty gets strength.

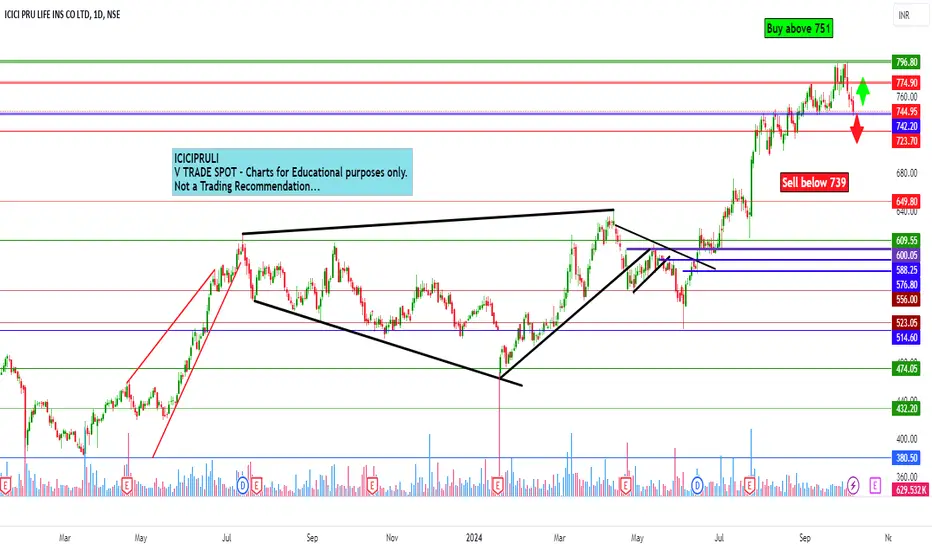
ICICI Prudential Life Insurance Co. view for Intraday 8th octICICI Prudential Life Insurance Company Limited view for Intraday 8th October #ICICIPRULI
Buying may witness above 751
Support area 740. Below ignoring buying momentum for intraday
Selling may witness below 739
Resistance area 750-751
Above ignoring selling momentum for intraday
Charts for Educational purposes only.
Please follow strict stop loss and risk reward if you follow the level.
Thanks,
V Trade Point
ICICI PRU LIFE S/RSupport and Resistance Levels:
Support Levels: These are price points (green line/shade) where a downward trend may be halted due to a concentration of buying interest. Imagine them as a safety net where buyers step in, preventing further decline.
Resistance Levels: Conversely, resistance levels (red line/shade) are where upward trends might stall due to increased selling interest. They act like a ceiling where sellers come in to push prices down.
Breakouts:
Bullish Breakout: When the price moves above resistance, it often indicates strong buying interest and the potential for a continued uptrend. Traders may view this as a signal to buy or hold.
Bearish Breakout: When the price falls below support, it can signal strong selling interest and the potential for a continued downtrend. Traders might see this as a cue to sell or avoid buying.
20 EMA (Exponential Moving Average):
Above 20 EMA(50 EMA): If the stock price is above the 20 EMA, it suggests a potential uptrend or bullish momentum.
Below 20 EMA: If the stock price is below the 20 EMA, it indicates a potential downtrend or bearish momentum.
Trendline: A trendline is a straight line drawn on a chart to represent the general direction of a data point set.
Uptrend Line: Drawn by connecting the lows in an upward trend. Indicates that the price is moving higher over time. Acts as a support level, where prices tend to bounce upward.
Downtrend Line: Drawn by connecting the highs in a downward trend. Indicates that the price is moving lower over time. It acts as a resistance level, where prices tend to drop.
RSI: RSI readings greater than the 70 level are overbought territory, and RSI readings lower than the 30 level are considered oversold territory.
Combining RSI with Support and Resistance:
Support Level: This is a price level where a stock tends to find buying interest, preventing it from falling further. If RSI is showing an oversold condition (below 30) and the price is near or at a strong support level, it could be a good buy signal.
Resistance Level: This is a price level where a stock tends to find selling interest, preventing it from rising further. If RSI is showing an overbought condition (above 70) and the price is near or at a strong resistance level, it could be a signal to sell or short the asset.
Disclaimer:
I am not a SEBI registered. The information provided here is for learning purposes only and should not be interpreted as financial advice. Consider the broader market context and consult with a qualified financial advisor before making investment decisions.

ICICI Prudential Life Insurance view for Intraday 10th SeptemberICICI Prudential Life Insurance view for Intraday 10th September #ICICIPRULI
Buying may witness above 763
Support area 752. Below ignoring buying momentum for intraday
Selling may witness below 752
Resistance area 763
Above ignoring selling momentum for intraday
Charts for Educational purposes only.
Please follow strict stop loss and risk reward if you follow the level.
Thanks,
V Trade Point

Possible shortAgressive entry red arrow
Safe below 747.25 sl red zone.
Not a trade suggestion**
Study purpose.
