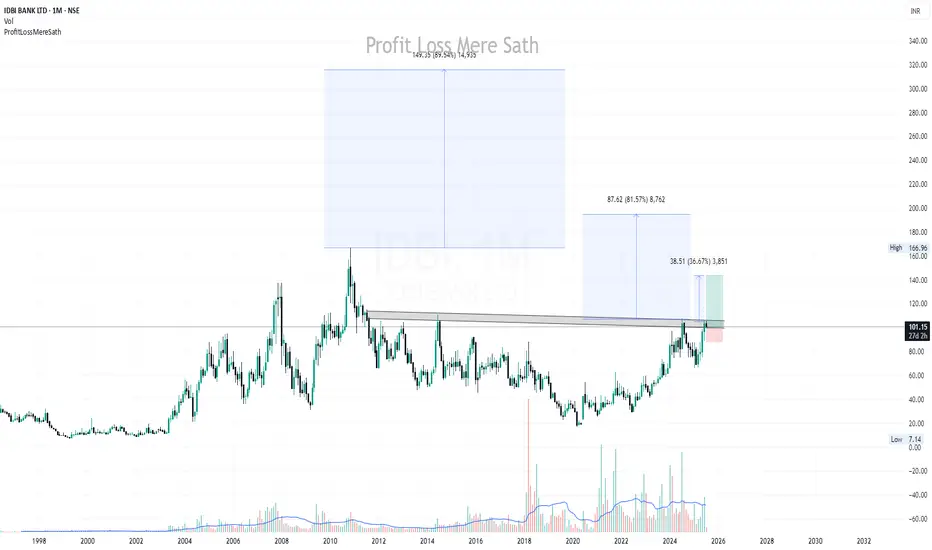
IDBI BANK LTD - for Long-Term🚀 Breakout Alert!
IDBI Bank has finally broken out of a multi-year resistance zone that was acting as a strong supply area since 2010. The breakout is supported by significant volume, indicating strong institutional participation.
🟩 Structure Highlights:
Price has broken above the long-term horizo
7.36 INR
76.31 B INR
341.48 B INR
5.86 B
About IDBI BANK LTD
Sector
Industry
CEO
Rakesh Sharma
Website
Headquarters
Mumbai
Founded
1964
ISIN
INE008A01015
FIGI
BBG000FK7WV6
IDBI Bank Ltd. engages in the provision of commercial banking services to retail and corporate customers. It operates through the following segments: Corporate and Wholesale Banking; Retail Banking; Treasury; and Other Banking and Group Operations. The Corporate and Wholesale Banking segment includes corporate relationship covering deposit and credit activities other than retail, as well as corporate advisory and syndication, project appraisal, and investment portfolio. The Retail Banking segment comprises of credit and deposit activities that are primarily oriented towards individuals and small business including priority sector lending. The Treasury segment trades portfolio of investments, money market operations, derivative trading, and foreign exchange operations on the proprietary account and for customers. The Other Banking and Group Operations segment Includes operations and activities of group companies other than bank. The company was founded on July 01, 1964 and is headquartered in Mumbai, India.
Related stocks
IDBI : Red band Resistance on a monthly time frame IDBI : Red band Resistance on a monthly time
frame.
There is a Buy triggered on a daily time frame at 100 but on a monthly time frame there is a major Red Band Resistance.
On a 3 Month frame also it is almost sitting just above and around Red band Resistance.
To continue the rally these Red B

Positional Setup: IDBI Bank Ltd (NSE)Chart Pattern: Cup and Handle Formation
CMP: ₹101.33
Technical Structure: Classic bullish Cup & Handle breakout setup in progress
Volume: Noticeable rise in volumes at breakout zones
Momentum: RSI & moving averages support the trend continuation
📊 Technical Levels (Positional Setup)
Support Zon

IDBI Bank : Buy triggered but sitting right at a Red band ResisIDBI Bank : Buy triggered but sitting right at a Red band Resistance .
Last time it has turned back from 104 and 107
( Not a Buy / Sell Recommendation
Do your own due diligence ,Market is subject to risks, This is my own view and for learning only .)

IDBI- Analysis Only for long term investors
As you can see stock has made top in November 2010 and from March 2020 it has given close to 400% returns, can this trend continue for next 1-2 years or more?
It will be a good to keep buying this stock on every retracements. Good buying range will be around 83 to 9

IDBI Bank LTDIn this analysis, we are focusing on Price Action and using pullback trading as our method of trading.
Based on our trading methodology, the price has recently pulled back into the demand zone in the monthly chart, with a target of 105. The weekly chart has been in an uptrend, but recently has si

IDBI Bank Looking to make a comeback on Weekly Charts. IDBI Bank Ltd. engages in the provision of commercial banking services to retail and corporate customers. It operates through the following segments: Corporate and Wholesale Banking; Retail Banking; Treasury; and Other Banking and Group Operations. The Corporate and Wholesale Banking segment include

IDBI BANK SWING TRADE📊 Price Action & Trend Analysis
Analyzing market trends using price action, key support/resistance levels, and candlestick patterns to identify high-probability trade setups.
Always follow the trend and manage risk wisely!
Price Action Analysis Interprets Market Movements Using Patterns And Trend

Reading a chart is not a very difficult art. Today we will try to understand how to read the charts how to make assumptions based on the same. First thing that one must understand that it is not a rocket science. One has to be creative, attentive and a sort of meditative. Albert Einstein once said that "it is not that I am smart but I stay wit

IDBI DAILY CHART TIME FRAME - MY VIEW ONLYThe Structure looks good to us, waiting for this instrument to correct and then give us these opportunities as shown on this instrument (Price Chart).
Note: Its my view only and its for educational purpose only. Only who has got knowledge about this strategy, will understand what to be done on this

See all ideas
Summarizing what the indicators are suggesting.
Oscillators
Neutral
SellBuy
Strong sellStrong buy
Strong sellSellNeutralBuyStrong buy
Oscillators
Neutral
SellBuy
Strong sellStrong buy
Strong sellSellNeutralBuyStrong buy
Summary
Neutral
SellBuy
Strong sellStrong buy
Strong sellSellNeutralBuyStrong buy
Summary
Neutral
SellBuy
Strong sellStrong buy
Strong sellSellNeutralBuyStrong buy
Summary
Neutral
SellBuy
Strong sellStrong buy
Strong sellSellNeutralBuyStrong buy
Moving Averages
Neutral
SellBuy
Strong sellStrong buy
Strong sellSellNeutralBuyStrong buy
Moving Averages
Neutral
SellBuy
Strong sellStrong buy
Strong sellSellNeutralBuyStrong buy
Displays a symbol's price movements over previous years to identify recurring trends.
862IDBI30
IDBI-8.62%-31-12-30-PVTYield to maturity
—
Maturity date
Dec 31, 2030
880IDBI26
IDBI-8.80%-9-2-26-PVTYield to maturity
—
Maturity date
Feb 9, 2026
862IDBI26
IDBI-8.62%-2-1-26-PVTYield to maturity
—
Maturity date
Jan 2, 2026
See all IDBI bonds
Frequently Asked Questions
The current price of IDBI is 93.23 INR — it has decreased by −3.64% in the past 24 hours. Watch IDBI BANK LTD stock price performance more closely on the chart.
Depending on the exchange, the stock ticker may vary. For instance, on NSE exchange IDBI BANK LTD stocks are traded under the ticker IDBI.
IDBI stock has fallen by −6.49% compared to the previous week, the month change is a 0.84% rise, over the last year IDBI BANK LTD has showed a −1.90% decrease.
IDBI reached its all-time high on Nov 11, 2010 with the price of 202.25 INR, and its all-time low was 13.90 INR and was reached on Jan 30, 2002. View more price dynamics on IDBI chart.
See other stocks reaching their highest and lowest prices.
See other stocks reaching their highest and lowest prices.
IDBI stock is 4.29% volatile and has beta coefficient of 1.63. Track IDBI BANK LTD stock price on the chart and check out the list of the most volatile stocks — is IDBI BANK LTD there?
Today IDBI BANK LTD has the market capitalization of 1.00 T, it has increased by 0.80% over the last week.
Yes, you can track IDBI BANK LTD financials in yearly and quarterly reports right on TradingView.
IDBI net income for the last quarter is 20.19 B INR, while the quarter before that showed 20.87 B INR of net income which accounts for −3.27% change. Track more IDBI BANK LTD financial stats to get the full picture.
Yes, IDBI dividends are paid annually. The last dividend per share was 2.10 INR. As of today, Dividend Yield (TTM)% is 1.61%. Tracking IDBI BANK LTD dividends might help you take more informed decisions.
IDBI BANK LTD dividend yield was 2.70% in 2024, and payout ratio reached 29.59%. The year before the numbers were 1.85% and 27.86% correspondingly. See high-dividend stocks and find more opportunities for your portfolio.
As of Jul 26, 2025, the company has 19.73 K employees. See our rating of the largest employees — is IDBI BANK LTD on this list?
Like other stocks, IDBI shares are traded on stock exchanges, e.g. Nasdaq, Nyse, Euronext, and the easiest way to buy them is through an online stock broker. To do this, you need to open an account and follow a broker's procedures, then start trading. You can trade IDBI BANK LTD stock right from TradingView charts — choose your broker and connect to your account.
Investing in stocks requires a comprehensive research: you should carefully study all the available data, e.g. company's financials, related news, and its technical analysis. So IDBI BANK LTD technincal analysis shows the sell today, and its 1 week rating is buy. Since market conditions are prone to changes, it's worth looking a bit further into the future — according to the 1 month rating IDBI BANK LTD stock shows the buy signal. See more of IDBI BANK LTD technicals for a more comprehensive analysis.
If you're still not sure, try looking for inspiration in our curated watchlists.
If you're still not sure, try looking for inspiration in our curated watchlists.