IDFC bank buy setupWe can see volume divergence in IDFC bank. buy with a Sl of 62 and TP1=72 TP2=77.
IDFCFIRSTB trade ideas

IDFCFIRSTB : Poised for a Wave C Reversal or Deeper Dive?1. Key Analysis and Levels
Wave C Completion Zone (₹63-61):
Based on Elliott Wave analysis, this marks the end of the corrective phase (Wave C).
This range aligns with a high-probability demand zone, where buyers typically enter aggressively.
Liquidity and Consolidation Zone (₹61-67):
Current price behavior indicates consolidation, suggesting accumulation by buyers or preparation for a reversal.
First Target Zone (₹78-80):
Represents the extended retracement of Intermediate Wave B, a logical zone for profit-taking.
Second Target Zone (₹86-88):
A deeper retracement of the Primary Wave B, achievable if bullish momentum sustains beyond the first target zone.
2. Trade Setup
A. Long Trade Setup:
Why Long?
The price appears to have found support in the Wave C completion zone with signs of consolidation, signaling a potential reversal.
Elliott Wave theory suggests the next leg (Wave 1 or Wave A) to the upside.
Entry: Around ₹64, after a confirmed breakout from consolidation or bullish candlestick patterns (e.g., hammer or engulfing).
Stop Loss: Below ₹61 to account for demand zone failure.
Targets:
₹78-80: First resistance level at the extended retracement of Wave B (Intermediate).
₹86-88: Next significant resistance zone based on Primary Wave B retracement.
B. Short Trade Setup (If Demand Fails):
Why Short?
A breakdown below ₹61 indicates that the Wave C completion zone is breached, suggesting continuation of the downtrend.
This breakdown could trigger a deeper decline toward the next structural support levels.
Entry: Below ₹61 after confirmation of breakdown with volume.
Targets:
₹58: Immediate support zone.
₹52-55: Deeper structural demand area.
Stop Loss: Above ₹65 to avoid being caught in a false breakdown.
3. Explanation of Analysis
Wave C Completion:
In Elliott Wave theory, Wave C often marks the end of a corrective phase, making it a high-probability entry point for reversals.
Liquidity Zone (₹61-67):
Current consolidation reflects market participants accumulating positions, often seen before a major price move.
Risk-Reward Dynamics:
The defined stop loss and target zones provide favorable risk-to-reward ratios, making the trade setups attractive.
4. Confirmation Signals
For Long Entry:
Bullish price action in the ₹63-64 range with rising volume.
A breakout above ₹67 signals momentum shift to the upside.
For Short Entry:
A strong daily close below ₹61, accompanied by high volume and bearish sentiment.
5. Risk Management
Risk should be limited to 1-2% of your portfolio per trade, adhering strictly to stop loss levels.
Consider scaling out at the first target zone to lock in partial profits while trailing stop loss to protect gains.
Why This Plan Works
This trading plan integrates Elliott Wave theory, demand zone dynamics, and logical retracement levels to structure trades with both upside potential (if reversal occurs) and downside readiness (if support fails).

Identifying Breakout in IDFC First BankAs of 15th September,2023 the stock is currently at Rs 94.55 - Rs 95 levels with potential breakout possibilities due to macroeconomics and other reasons.
The stock seems to be in buy zone around the price range 95 to 100,102.
With a strong resistance around the price of 85 - 86 levels which can be considered as an avg down opportunity.
Also, another resistance can be formed at the price level of 75 - 76 which can be treated as a Stoploss.
Breakout possibility can occur once the stock surpasses the channel of 105 - 110 price range.
With First Target around 125 - 127 price levels
and Second Target around 130 - 145 price levels.
In a time frame of 3 to 6 months.
Caution: This is not a stock trading Advice or Tip, it's just for learning purposes I am not a professional trader or a SEBI registered advisor. Please don't consider this as an advice and make your own analysis before investing.
Thankyou!

FUNDAMENTAL VS TECHNICALFundametally IDFC FIRST BANK shown huge loss even then i am bullish for next trading day as per my analysis 64.79 will be maximum low if it broken then other supports will be activated until iam bullish.

IDFC can be ready to ExplodeWe all know A Stock has 3 Life Stages, Uptrend, Sideways and then Correction. Then again Sideways to even continue High. Currently we can see Sideways Stage after a Nice Correction in IDFC FIRST BANK. Can look for buys buy price closes above 76.5-77 price lvl.

IDFC First Bank LtdIDFC First Bank Ltd
- near Monthly Support Zone
- Good if bounces and holds above it.
- Weakness will be witnessed below given support line.
Negatives - Even though it has given a new All-Time-High but it did not sustained.

IDFCFIRSTBANK_06.10.2024Last movement of IDFCFIRSTBANK with such pattern formation was from 40 rs to 100 rs.
Now stock is at 70 with similar pattern and similar retracement. I think this could be groundbreaking with positive new like amalgamation of IDFC FIRST BANK and IDFC LTD.
If all works out could my targets are 118.

LONG ON IDFCFIRSTBANKIDFCFIRSTBANK can be bought over this zone seem good to buy above this
may give a move of 30%. over 400 ema on 1d timeframe
long way back trendline
check rsi for divergence on breakout
on breakout check macd and volume for confirmation.

IDFCFIRSTBANK_22.09.2024fibonacci retracement completed. Very good trade, chances to double the money with RR 1:7.
Enter between 70 to 73, SL 68, Tgt 84, 98, 118.For study purpose only.

Swing and positional trade in IDFC first bankIDFC First Bank Ltd. engages in the provision of financial and banking solutions. It operates through the following segments: Treasury, Corporate and Wholesale Banking, Retail Banking, Other Banking Business, and Unallocated.
We had recommended this stock earlier near 50-55 zone before breakout and from there it has become double. This stock has rosen 300% last year and after making a high of 100.70 it is taking pullback. From all time high, this stock has been corrected 40% as per the long wave and currently trading at the golden zone of 61% for the short wave.
On monthly chart, selling seems to be cooling down but no clear sign of buying is observed.
On weekly timeframe, it has shown some bullishness near 72rs and created SCOB which seems to be followed in the daily time frame.
On daily timeframe, price has taken liquidity of previous swing and is also following the FVG created around 71.50.
Agressive buyers can take entry at 74.50 with SL of 70rs. Otherwise, wait for price to close above 76rs to take safe entry. Targets are mentioned on the chart.
This is pure technical analysis and not a buy/sell recommendation. Please refer your financial adviser before putting your money in stock market.
Always follow the risk management, it is key to be a successful person in stock market.
In case of any doubt, or want analysis of any stock, please drop a comment or DM me.
Happy trading :)

idfcfirstbank_15.09.2024IDFCFirstBank target 77 easy trade of 3.5 points.
for educational purposes only.

IDFC First bank ReversalIDFC first bank is getting ready to change its short term trend towards upside. looks like poised for a medium term target of previous highs.

Long It's my personal opinion that ,this stock is going to touch 147-150 very soon , once it breaks level of 90 I see it as buy on dip opportunity chart is saying that. It is moving in channel right now any news might explode this stock
This all is my personal view on this , and no advice for financial decision , your money your decision
For educational purpose only
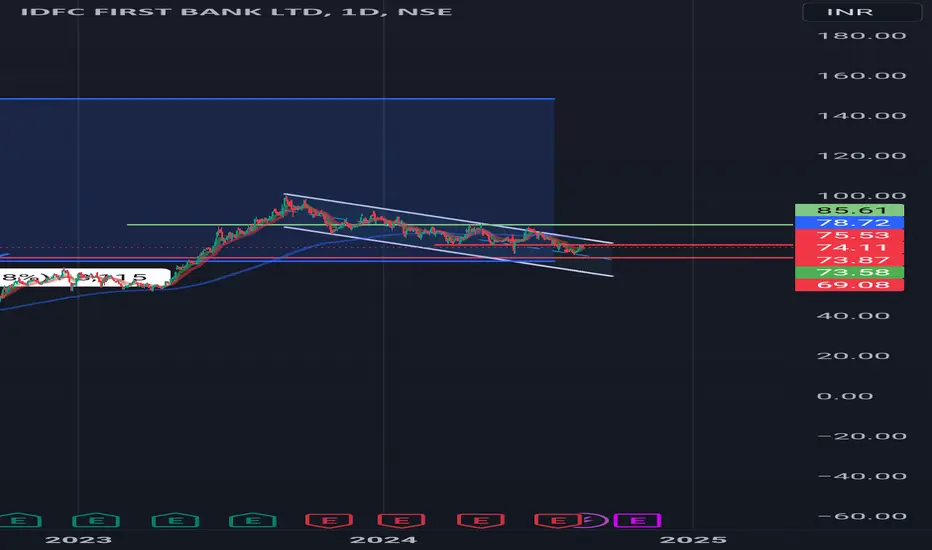
Technical Analysis of IDFC First Bank Ltd (IDFCFIRSTB)Technical Analysis of IDFC First Bank Ltd (IDFCFIRSTB)
Key Observations from the Chart
Price Action: The stock price appears to be consolidating after a recent uptrend. There is a potential support level at around 74.43 and a resistance level near 75.54.
Moving Averages: The 200-day EMA (Exponential Moving Average) is above the current price, suggesting a potential bearish bias. However, a break above this EMA could signal a bullish trend reversal.
Fibonacci Retracement Levels: The price is currently near the 0.236 Fibonacci retracement level, which could provide support. A break below this level could indicate further downside.
Relative Strength Index (RSI): The RSI is around 50, indicating a neutral market sentiment. A reading below 30 could suggest oversold conditions, while a reading above 70 could indicate overbought conditions.
Potential Trading Strategies
1. Range Trading: Given the current consolidation, a range trading strategy could be considered. Buy near the support level (around 74.43) and sell near the resistance level (around 75.54).
2. Breakout Strategy: If the price breaks above the 200-day EMA or the resistance level, a bullish breakout could occur. A buy order could be placed above the breakout level.
3. Pullback Strategy: If the price pulls back to the 0.236 Fibonacci retracement level or the support level, a potential buying opportunity could arise.
Additional Considerations
Fundamental Analysis: While technical analysis provides insights into price movements, it's essential to consider fundamental factors such as the bank's financial health, industry trends, and economic conditions.
Risk Management: Always implement risk management strategies, such as stop-loss orders, to protect your capital.
Note: This analysis is based on the information available in the chart. Market conditions can change rapidly, and it's crucial to stay updated with the latest news and developments.
Disclaimer: This analysis is based on the Technical Analysis of the stock chart and is for informational purposes only. It does not constitute financial advice. Always consult with a financial advisor before making investment decisions. I am not SEBI registered person and this is my personal opinion about the stock. Do your own research. We are not responsible for your loss.
Thanks for your support as always

IDFC FIRST BANK LTDIDFC FIRST BANK LTD
Long-term view!
.
Consolidation from 6 to 7 months.
Bullish Divergence form in Day TF.
Near BB Support level at weekly TF.
If it closes above 80 on the day-closing basis (Add more Quantity)
R1 -79
R2 -82
.
SL 70
Deep SL 67 on a closing basis.
.
.
.
This is Kartik Thakur,
Signing off
:)

IDFCFIRSTBHi guys,
In this chart i Found a Demand Zone in IDFCFIRSTB CHART for Positional entry,
Observed these Levels based on price action and Demand & Supply.
*Don't Take any trades based on this Picture.
... because this chart is for educational purpose only not for Buy or Sell Recommendation..
Thank you

Idfc first Bank Target 100 ??Idfc first bank elliot wave analysis one hour chart . This stock complete downside impulse wave and price break upside 2 or 4 trendline . this stock indicate bullish sound and stoploss use impulse wave

IDFC First Bank Elliot Wave AnalysisElliot first wave: Starting point 17.65 Endpoint 69.30
Elliot second wave: Starting point 69.30 Endpoint 28.95 Retraced 78.9%
Elliot third wave: Starting point 69.30 Endpoint 94.60 Projected 1.27%
Elliot fourth wave: Starting point 94.60 Endpoint Not yet formed
Usually, the 4th wave should retrace 38.2% and continue with an upward trend.
If you check closely the RSI on the weekly timeframe, it does not decline compared to the price. This price is a sign of bullishness.
One can trade for risk a reward ratio of more than 4.

idfc bank is good support market move then stock move up side now support zone market move then stock move all time high good stock for long turm

IDFC first bank breakout alertAfter long consolidation in a range bound.forming pole and flag pattern. Now breakout in the stock is near.can make a long position.
Buy level 84.5-86.5.
Sl 70
Target 120

IDFC First bank - Flag Pole Tgt: 108~118Technical confirmation done. Fundamental push required to reach target

Pole and flag pattern on daily time frameIDFC FIRST BANK made a flag and pole pattern on daily time frame. price already break the trend line and coming for retest level. if its break the 84 level in upcoming treading day than its gave a 10 to 15 % in short term. keep watch this stock in your watchlist.

#Idfc first bank swing trade As you can see in chat a clear picture of bull flag pattan as long Consolation in channel after brake out it will reach to all time high with small Stop-loss we can plan for long 1 to 2 weeks for 15 to 17 percent return
