#IFB IND - Nenstar Pattern observed ( Bearish Pattern)#IFB IND - Nenstar Pattern observed ( Bearish Pattern)
#IFB IND -CMP 2270
As per technical setup , following is the observation : -
Short IFB IND With stop Loss of 2358 ; Tgt 1 2015 ; Tgt 2 1870
Disclaimer : Not a SEBI registered - above is not a buy / sell trade tip or advice, only for technical paper trade.
IFBIND trade ideas

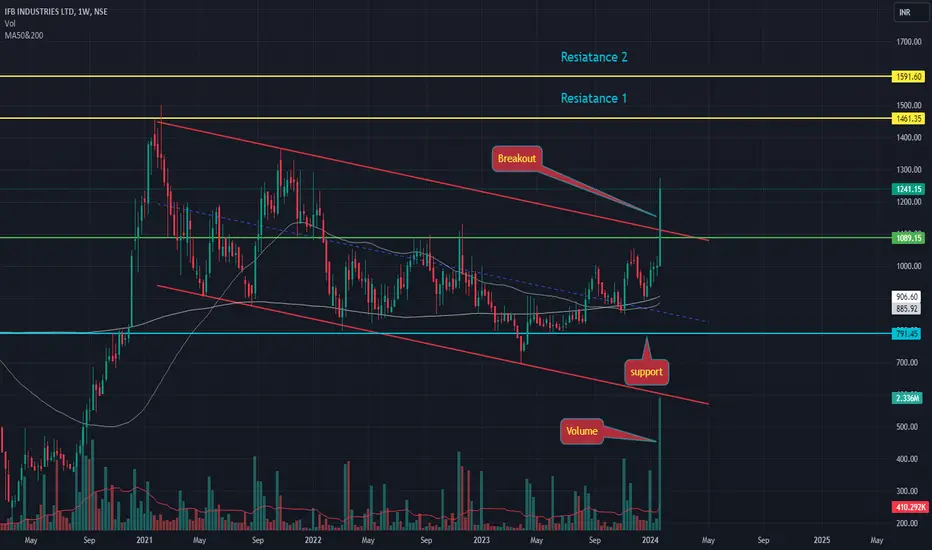
IFB INDUSTRIES LTD S/R Support and Resistance Levels:
Support Levels: These are price points (green line/shade) where a downward trend may be halted due to a concentration of buying interest. Imagine them as a safety net where buyers step in, preventing further decline.
Resistance Levels: Conversely, resistance levels (red line/shade) are where upward trends might stall due to increased selling interest. They act like a ceiling where sellers come in to push prices down.
Breakouts:
Bullish Breakout: When the price moves above resistance, it often indicates strong buying interest and the potential for a continued uptrend. Traders may view this as a signal to buy or hold.
Bearish Breakout: When the price falls below support, it can signal strong selling interest and the potential for a continued downtrend. Traders might see this as a cue to sell or avoid buying.
20 EMA (Exponential Moving Average):
Above 20 EMA(50 EMA): If the stock price is above the 20 EMA, it suggests a potential uptrend or bullish momentum.
Below 20 EMA: If the stock price is below the 20 EMA, it indicates a potential downtrend or bearish momentum.
Trendline: A trendline is a straight line drawn on a chart to represent the general direction of a data point set.
Uptrend Line: Drawn by connecting the lows in an upward trend. Indicates that the price is moving higher over time. Acts as a support level, where prices tend to bounce upward.
Downtrend Line: Drawn by connecting the highs in a downward trend. Indicates that the price is moving lower over time. It acts as a resistance level, where prices tend to drop.
RSI: RSI readings greater than the 70 level are overbought territory, and RSI readings lower than the 30 level are considered oversold territory.
Combining RSI with Support and Resistance:
Support Level: This is a price level where a stock tends to find buying interest, preventing it from falling further. If RSI is showing an oversold condition (below 30) and the price is near or at a strong support level, it could be a good buy signal.
Resistance Level: This is a price level where a stock tends to find selling interest, preventing it from rising further. If RSI is showing an overbought condition (above 70) and the price is near or at a strong resistance level, it could be a signal to sell or short the asset.
Disclaimer:
I am not a SEBI registered. The information provided here is for learning purposes only and should not be interpreted as financial advice. Consider the broader market context and consult with a qualified financial advisor before making investment decisions.

GOING TO BLUE SKY ZONE, IFB IND...NSE:IFBIND trade at 2150 level. Stocks give a breakout after 7 years. Now ready to trade above all time high level...

IFB Industry Weekly ChartMultiyear High Breaks
Volume Growth
RSI above 60 Daily / Weekly / Monthly
Round Bottom Pattern
support 1320
Expected level 2310

IFBIND2X from exit poll fiasco day
makes me think better to sit on more cash and wait to pounce on these gifts
anyways live and learn for now heading to the magnet above with invalidation below white line

IFBIND - Bullish Setup oNStock name - Ifb Industries Limited.
✅#IFBIND trading above Resistance of 1591.
✅Next Resistance is at 2320.
✅Moved 49% in 28 weeks.
Weekly chart setup
Chart is self explanatory. Levels of breakout, possible up-moves (where stock may find resistances) and support (close below which, setup will be invalidated) are clearly defined.
Master Score - B
Disclaimer: This is for demonstration and educational purpose only. this is not buying and selling recommendations. I am not SEBI registered. please consult your financial advisor before taking any trade.


IFBINDNSE:IFBIND
One Can Enter Now !
Or Wait for Retest of the Trendline (BO) !
Or wait For better R:R ratio !
Note :
1.One Can Go long with a Strict SL below the Trendline or Swing Low.
2. R:R ratio should be 1 :2 minimum
3. Plan as per your RISK appetite and Money Management.
Disclaimer : You are responsible for your Profits and loss, Shared for Educational purpose


IFB: A 5+ year breakout candidate IFB : this would be the third breakout attempt in last 5 -6 years
Stock is in strong uptrend and the strength seemingly suggest a strong upmove likely in short to medium term perspective
stock is up by almost 50% in two months suggest the strength and outperformance
support at 1270-1240 area while with the intensity of this breakout in consideration , can test 1870-1990 and 2130 in next few months

I'm Finally Blasting "IFB" Industries :) - Part 2IFB Industries on a longer term has formed a Big Flag Pole pattern and Cup and Handle Pattern.
After the Flag BO, it is creating newer patterns - Watch from Right to Left - as the stock increases it is creating Fresh Rounding Bottom patterns at each step - each Cup (Rounding Bottom) bigger than the previous one causing bigger upside Targets
Targets
1) 1500
2) 1990
3) 2800
4) 4000
Disclaimer:
Stocks-n-Trends is NOT a SEBI registered company. We do not provide Buy / Sell recommendations - rather we provide detailed analysis of how to review a chart, explain multi--timeframe views purely for Educational Purposes. We strongly suggest our followers to "Learn to Ride the Tide" and consult your Financial Advisors before taking any positions.
If you like our detailed analysis, please do rate us with your Likes, Boost and share your comments
-Team Stocks-n-Trends

IFB INDUSTRIES Already gave breakiut with big strong green body candle on monthly timeframe, bouncing back from 50 EMA.
Crossed resistance and trendline, fresh volume incoming from past few months.

IFBINDStock name = Ifb Industries Limited.
Weekly chart setup
Chart is self explanatory. Levels of breakout, possible up-moves (where stock may find resistances) and support (close below which, setup will be invalidated) are clearly defined.
Master Score = B
Disclaimer: This is for demonstration and educational purpose only. this is not buying and selling recommendations. I am not SEBI registered. please consult your financial advisor before taking any trade.
I'm Finally Blasting "IFB" Industries :)IFB Industries is a Fundamentally Strong stock, but despite all fundamentals every stock has its Rise and faces its Correction. IFB has been forming a Big Cup & Handle Pattern on Monthly Level since 2017 - yes almost 7 years of forming a Bullish Pattern.
Finally IFB has decided to Breakout and Blast. It has broken out of the Cup & Handle on Monthly and while doing so, it has also formed and Broken out of a Fresh Rounding Bottom Pattern on Weekly above 1130
Now Targets are 1560, 1990, 2800, and Long Term 4000++. The time has finally come for this lagger to move - This is NOT the time to Book Profits / Exit the stock because you Gave up mentally waiting for this BO to happen. Keep holding your winner. It will go miles from here
Disclaimer:
Stocks-n-Trends is NOT a SEBI registered company. We do not provide Buy / Sell recommendations - rather we provide detailed analysis of how to review a chart, explain multi--timeframe views purely for Educational Purposes. We strongly suggest our followers to "Learn to Ride the Tide" and consult your Financial Advisors before taking any positions.
If you like our detailed analysis, please do rate us with your Likes, Boost and share your comments
-Team Stocks-n-Trends

Price Reverse from MultiYear Support Price reverse from Multiyear Support in Monthly chart and also break from weekly down trend channel and if we look at price action high probability price continue its up move and in this case latest swing low act as a exit point in weekly time frame .

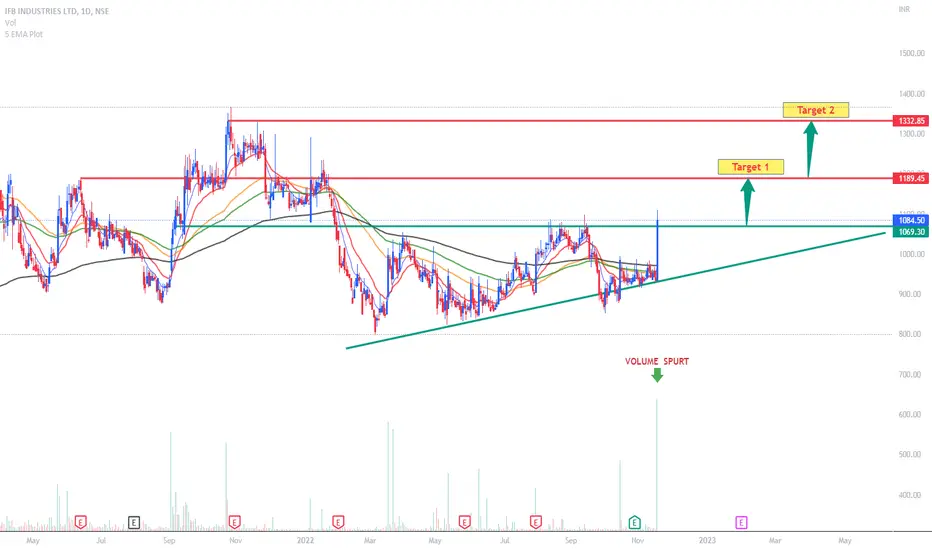
IFB INDUSTRIES BREAKOUT ON DAILY TIMEIfb industry has given a break out with strong volumes
Stock has given breakout of 200 day ema and trend line breakout.
Further there is 9 month 11 month high made as the stock on closing basis made 1084 when 1081 was its very strong resistance
CAN FACE RESISTANCE AT 1250 LEVELS
Only for Educational Purpose

IFBProducts :
Home Appliances Division (82% of revenue) - covers both the domestic appliance and industrial application categories and includes washing machines, domestic and industrial dishwashers, etc.
Engineering Division (17% revenue contribution) includes a product range of fine-blanked components, tools, and related machine tools like straighteners, strip loaders, etc. It mainly caters to the automobile sector (2 wheelers, 4-wheelers, and commercial vehicles).
Trading above 10 , 21, 63 , 100 , 200 EMA , Breakout with volume sourt
Target given in chart with SL of 946.
Market Cap
₹ 4,394 Cr.
Promoter holding
75.0 %
Pledged percentage
0.00 %
Debt
₹ 294 Cr
Price to book value
6.63
Buy at Current market price it gives good breakout
And volumes also looks good on bullish side
It gives close above round no i.e1000
So good for buy

Buy if it close above 1000it took good support and bounce back
Buy if it gives close above 1000 level
And our target will be 1100

IFB Industries India Sun Storm Investment Trading Desk & NexGen Wealth Management Service Present's: SSITD & NexGen Portfolio of the Week Series
Focus: Worldwide
By Sun Storm Investment Research & NexGen Wealth Management Service
A Profit & Solutions Strategy & Research
Trading | Investment | Stocks | ETF | Mutual Funds | Crypto | Bonds | Options | Dividend | Futures |
USA | Canada | UK | Germany | France | Italy | Rest of Europe | Mexico | India
Disclaimer: Sun Storm Investment and NexGen are not registered financial advisors, so please do your own research before trading & investing anything. This is information is for only research purposes not for actual trading & investing decision.
#debadipb #profitsolutions

Breakout of triangleIFB has just BO'd from a wedge like pattern..targets marked. This is a small cap. Tread with caution. DO your own research.This is an idea. One important thing - it is trading above the 200 EMA ( marked in red) which is a always an important moving average which even institutions and fund houses look at.
