INDIAN BANK📊 Trade Plan: Long Setup
Entry Stop Loss (SL) Risk Target Reward RR
645 601 44 pts 744 99 pts 2.3
📌 Risk-Reward Ratio (RR) of 2.3 is healthy for a swing trade
📌 Entry aligns with 60M demand zone and near Daily/Weekly zones
🔄 Key Reference Points
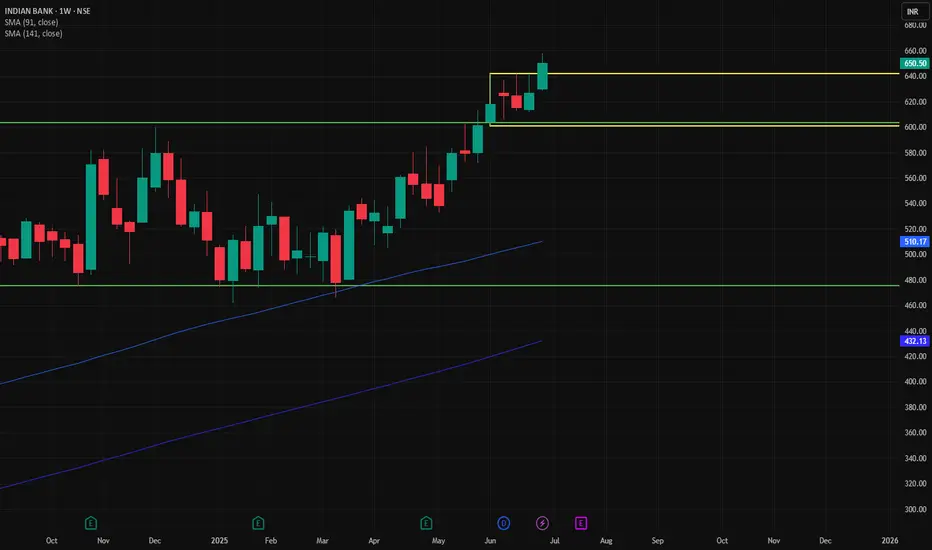
Last High: 603
Last Low: 462
Point Variance: 141
🔔 Potential breakout above 603 (last high) supports further upside
✅ Conclusion
Buy Zone: 645 (entry near upper demand edge)
Stop-Loss Safety: Below multiple strong zones (601–618)
Target: 744 (next probable supply/target zone)
🧠 Suggestion: You may trail SL as it moves above 675 to lock partial gains. Ideal for positional traders aiming for breakout continuation.
🔍 Trend & Demand Zone Overview
Timeframe Trend Demand Zone Type Proximal Distal Avg.
HTF (Yearly, Half-Yearly, Qtrly) UP BUFL 603 471 537
MTF (Monthly, Weekly, Daily) UP RALLY RALLY, BUFL, DMIP 627 604 616
ITF (240M, 180M, 60M) UP DMIP 636 618 627
✅ Overall Trend: Bullish (UP) across all timeframes
✅ Strong Base Formation: Consistent demand between 601–645
✅ Multiple Timeframe Confluence: Reinforces bullish structure and buying opportunity
INDIANB trade ideas
INDIANB - 640 ABOVEIndianb no have in very good levels, long consolidation breakout and sustaining near
ATH...
Above 640 possible good rally up side for short term gain


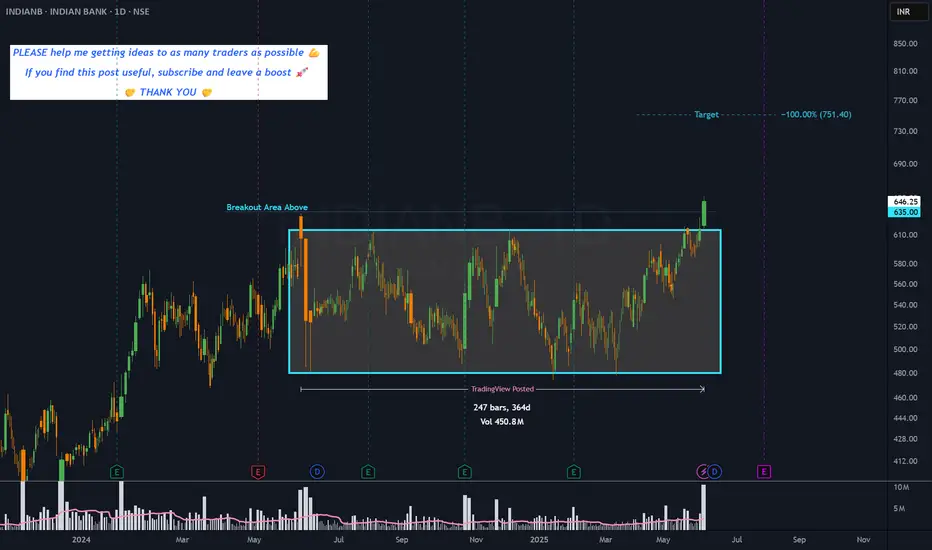
INDIANB - 1 year RECTANGLE══════════════════════════════
Since 2014, my markets approach is to spot
trading opportunities based solely on the
development of
CLASSICAL CHART PATTERNS
🤝Let’s learn and grow together 🤝
══════════════════════════════
Hello Traders ✌
After a careful consideration I came to the conclusion that:
- it is crucial to be quick in alerting you with all the opportunities I spot and often I don't post a good pattern because I don't have the opportunity to write down a proper didactical comment;
- since my parameters to identify a Classical Pattern and its scenario are very well defined, many of my comments were and would be redundant;
- the information that I think is important is very simple and can easily be understood just by looking at charts;
For these reasons and hoping to give you a better help, I decided to write comments only when something very specific or interesting shows up, otherwise all the information is shown on the chart.
Thank you all for your support
🔎🔎🔎 ALWAYS REMEMBER
"A pattern IS NOT a Pattern until the breakout is completed. Before that moment it is just a bunch of colorful candlesticks on a chart of your watchlist"
═════════════════════════════
⚠ DISCLAIMER ⚠
Breakout Area, Target, Levels, each line drawn on this chart and any other content represent just The Art Of Charting’s personal opinion and it is posted purely for educational purposes. Therefore it must not be taken as a direct or indirect investing recommendations or advices. Entry Point, Initial Stop Loss and Targets depend on your personal and unique Trading Plan Tactics and Money Management rules, Any action taken upon these information is at your own risk.
═════════════════════════════
Indian bank near Resistance breakout.No need to address here; look simple resistance seem, if bo give good potential to move. But key level is last up swing. Keep it wait and watch.

INDIANB Trading Near Tested Demand ZoneINDIANB is currently trading at ₹500.25, near a tested demand zone that spans ₹504.8 to ₹487.35, formed on 29th October 2024. Since this zone has been tested, it may provide limited support, and cautious monitoring is advised.
Disclaimer: This analysis is for informational purposes only and should not be considered as financial advice. Please conduct your own research or consult a financial advisor before making any investment or trading decisions.

Just a view (educational purpose only)Just a view (educational purpose only)
strictly buy above 560,
Target 620, 635 650
Completely on market condition

INDIANB Swing Trade WatchlistINDIANB is taking support from 50 EMA in Weekly Chart. (For Swing Trade)
We can go for long swing trade only after price going above 544 with approx. 7% stoploss and 21% Target.
Risk-Reward = 1:3
Plan your quantity/investment accordingly.
Note : Its just an analysis, wait for the price to confirm.
Disclaimer : Always follow risk to reward, this is the only key to success in market, no matter how much good a trade is looking we never know the future,

Buy Indian BankTarget - 598+
SL - 496 (Closing)
One of the financially strong PSU banks, with the least free float ranging in weekly EMA support level.

INDIAN BANK S/R Support and Resistance Levels:
Support Levels: These are price points (green line/share) where a downward trend may be halted due to a concentration of buying interest. Imagine them as a safety net where buyers step in, preventing further decline.
Resistance Levels: Conversely, resistance levels (red line/shade) are where upward trends might stall due to increased selling interest. They act like a ceiling where sellers come in to push prices down.
Breakouts:
Bullish Breakout: When the price moves above resistance, it often indicates strong buying interest and the potential for a continued uptrend. Traders may view this as a signal to buy or hold.
Bearish Breakout: When the price falls below support, it can signal strong selling interest and the potential for a continued downtrend. Traders might see this as a cue to sell or avoid buying.
20 EMA (Exponential Moving Average):
Above 20 EMA: If the stock price is above the 20 EMA, it suggests a potential uptrend or bullish momentum.
Below 20 EMA: If the stock price is below the 20 EMA, it indicates a potential downtrend or bearish momentum.
Trendline: A trendline is a straight line drawn on a chart to represent the general direction of a data point set.
Uptrend Line: Drawn by connecting the lows in an upward trend. Indicates that the price is moving higher over time. Acts as a support level, where prices tend to bounce upward.
Downtrend Line: Drawn by connecting the highs in a downward trend. Indicates that the price is moving lower over time. It acts as a resistance level, where prices tend to drop.
RSI: RSI readings greater than the 70 level are overbought territory, and RSI readings lower than the 30 level are considered oversold territory.
Combining RSI with Support and Resistance:
Support Level: This is a price level where a stock tends to find buying interest, preventing it from falling further. If RSI is showing an oversold condition (below 30) and the price is near or at a strong support level, it could be a good buy signal.
Resistance Level: This is a price level where a stock tends to find selling interest, preventing it from rising further. If RSI is showing an overbought condition (above 70) and the price is near or at a strong resistance level, it could be a signal to sell or short the asset.
Disclaimer:
I am not a SEBI registered. The information provided here is for learning purposes only and should not be interpreted as financial advice. Consider the broader market context and consult with a qualified financial advisor before making investment decisions.


Indian Bank close to breaking out (Again!)
Displaying strong sales & earnings momentum
Uptick in relative strength
extreme contraction in volatility and volume while hovering near the top of prior base
Already had a BO before election results from a 15wks/18% shallow flat base which had VCP characteristics
experienced some correction during election results related volatility but recovered quickly

Indian bank
Indian bank has formed an expanding channel..currently approaching the upper border.. if breaks out and hold then super bullish else can mark ultimate stoploss at 400-390 on closing basis.

INDIANBANKThe pattern speaks for itself. Tested the support level. the next couple of days will determine the trend. Pls do your own analysis before entering any trade

INDIAN BANK BREAKOUT"Indian Bank has recently broken out of a pattern with a strong candlestick formation, presenting a favorable opportunity to enter into the stock with a stop-loss placement ranging anywhere between 8% to 10%."

INDIAN BANKBreakout happend in this stock with rising 10 and 40 week MA's and RS indicator is also showing strength.
Keep your risk and reward ratios according to your own preferance.
This is for educational purpose, do your own research before investing.

IMPORTANT LEVELS FOR THE DECADE 2020-2030Hey Folks!
Every time when i share an idea my purpose is to reduce the entry levels to the minimum so that Guess work and Random entry can be avoided.
Keeping the above statement in mind today i sharing the levels for NSE:INDIANB that will be helpful in planning you building a swing position.
Rules are simple as you can see in charts that there are two colour channels , Green and the Red channel.
Generally lower level of the green channel are the value buying area Whereas middle level of the Green level are the normal buying level.
Normally Targets for Buying levels are upper levels of the red channel. But since these levels are for the decade so Consider every level as a target.
Plan Your swing trade at or near these levels to have an edge for your setup.
For any questions just drop a message!
All the Best Folks!

INDIANBNSE:INDIANB
One Can Enter Now !
Or Wait for Retest of the Trendline (BO) !
Or wait For better R:R ratio !
Note :
1.One Can Go long with a Strict SL below the Trendline or Swing Low.
2. R:R ratio should be 1 :2 minimum
3. Plan as per your RISK appetite and Money Management.
Disclaimer : You are responsible for your Profits and loss, Shared for Educational purpose

Indian Bank: can we expect another 10% rally?Looks like Indian Bank might try to test 465, lets see if that happens

Indian Bank stock looking good for breakout in daily time frame Indian Bank stock looking good for breakout in daily time frame

Indian Bank Monthly Chart Analysis for Long TermIndian Bank chart is looking strong on monthly chart and trading near a breakout zone we can consider Indian Bank above 450 with sl of 380 for long term .

INDIAN BANK multiyear breakout attempt Indian Bank attempted the multiyear breakout at the level of 430-390. At this level indian bank attempted a breakout on monthly chart and than comes in a consolidation. Formed Doji & Shooting Star which symbols a consolidation within a range.
Further stock needs to give breakout and close above the previous two months levels i.e 460.
Volume spark and than consolidation while being in a up trend shows a slow accumulation in a stock.
Re-Test level is 380-390
