Review and plan for 29th July 2025 Nifty future and banknifty future analysis and intraday plan.
Quarterly results.
This video is for information/education purpose only. you are 100% responsible for any actions you take by reading/viewing this post.
please consult your financial advisor before taking any action.
----Vinaykuma
Related indices

Review and plan for 21st July 2025Nifty future and banknifty future analysis and intraday plan.
Quarterly results.
This video is for information/education purpose only. you are 100% responsible for any actions you take by reading/viewing this post.
please consult your financial advisor before taking any action.
----Vinaykumar

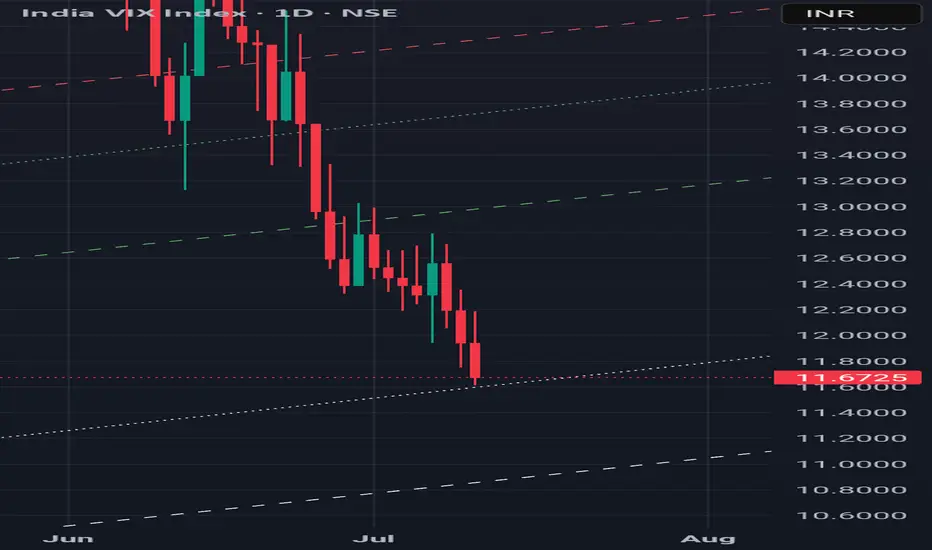
VIX will rise Indian market VIX low has done today now it will not fall more and from now on it will rise and nifty will fall down.
IS STOCK MARKET BIG FALL COMING ?Nifty bottom out 22000, We enjoyed almost 2500 rally, in spite of this, INDIA VIX the indicator of Fear & volatility didn't fall below 15 level and made double bottom . It support here two times on 16 April & 22 April And raised 15% till now currently traded above 18.50 level.
Does it make sense th

INDIA VIX Upward journey might START'since Union Budget, 25 % Falling India Vix making a good base, seeing nifty downtrend it may shoot up in upcoming days if it sustain above 15. technically it gave 20&50 EMA bullish crossover. If market fall with rising VIX it would sign of weakness again.

India Vix touched almost the lowest point of 2024, Buy Options
India VIX touched the bottom few days ago , which is also close to the lowest point of this year. Does that mean volatility can increase from here and make us some profit in buying options? please share your views.

High India VIX- great time to sell options and buy Index?
India vix is at 24 months high once again. I think it is great time to sell options and buy Index future of June. Money can be made on both sides this time.

India VIX and Nifty Analysis: Last 5 YearsThis is the chart of India VIX (Volatility Index or Fear Index) over the last 5 years. Observations show:
Market Reaction: Whenever VIX rises, the market tends to fall or consolidate.
Historical Insight: From the COVID-19 period to today, this pattern holds true.
Current Scenario: Due to the

Will the India VIX cool down from here?The India VIX recently has a hit a Daily SZ. It has risen from nearly 10% odd levels to greater than 20%. This is not a normal situation for this index. However there are elections in India and there will be a lot of uncertainty in the markets causing the VIX to rise in value. The India VIX and the

Avoid Credit strategiesIndia Vix is down by more than 20%. If at all any one is into fno, try deploying debit strategies rather than credit strategies.

See all ideas
Summarizing what the indicators are suggesting.
Oscillators
Neutral
SellBuy
Strong sellStrong buy
Strong sellSellNeutralBuyStrong buy
Oscillators
Neutral
SellBuy
Strong sellStrong buy
Strong sellSellNeutralBuyStrong buy
Summary
Neutral
SellBuy
Strong sellStrong buy
Strong sellSellNeutralBuyStrong buy
Summary
Neutral
SellBuy
Strong sellStrong buy
Strong sellSellNeutralBuyStrong buy
Summary
Neutral
SellBuy
Strong sellStrong buy
Strong sellSellNeutralBuyStrong buy
Moving Averages
Neutral
SellBuy
Strong sellStrong buy
Strong sellSellNeutralBuyStrong buy
Moving Averages
Neutral
SellBuy
Strong sellStrong buy
Strong sellSellNeutralBuyStrong buy
Displays a symbol's price movements over previous years to identify recurring trends.