INDIGO READY TO FLYINDIGO is nearing to all time high and now ready to FLY to make new Higher Highs.
Next report date
—
Report period
—
EPS estimate
—
Revenue estimate
—
187.90 INR
72.58 B INR
804.96 B INR
207.64 M
About INTERGLOBE AVIATION LTD
Sector
Industry
CEO
Peter T. M. Elbers
Website
Headquarters
Gurgaon
Founded
2004
ISIN
INE646L01027
FIGI
BBG009QLQHZ1
InterGlobe Aviation Ltd. engages in the provision of air transportation services. Its activities include the transportation of passengers, cargo, and mail on regularly scheduled flights and the provision of car rental, airport lounge, visa information, and insurance services. The company was founded by Rahul Bhatia and Rakesh Gangwal on January 13, 2004 and is headquartered in Gurgaon, India.
Related stocks

INTERGLOBE AVIATION looks weak if prvious week's low breachedINTERGLOBE AVIATION LOOKS WEAK IF PREVIOUS Week'S low breached
inveted hammer formed on weekly chart

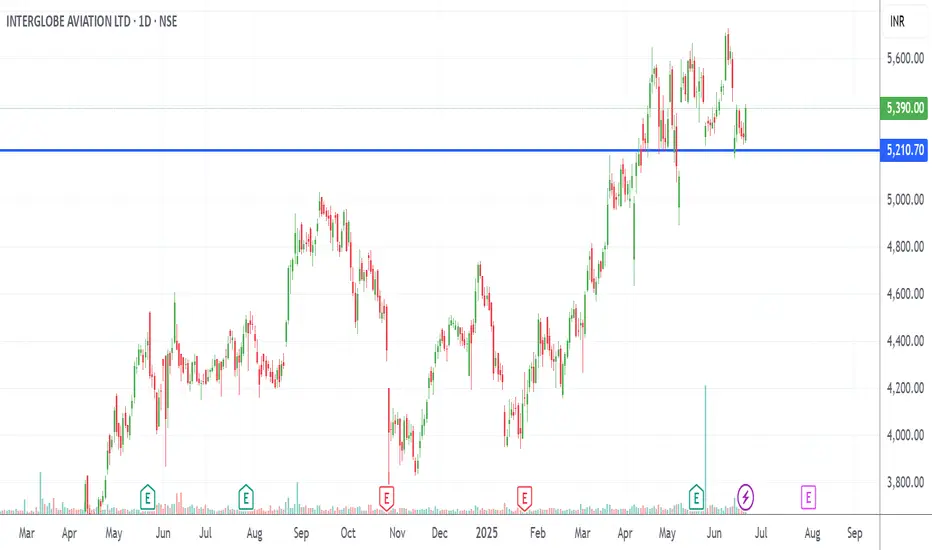
long term📊 Chart Overview
Current Market Price (CMP): ₹5,390.00
Day's Range: ₹5,241.50 – ₹5,408.00
Change: +₹119.00 (+2.26%)
Support Level: ₹5,210.70 (marked on chart)
🔍 Technical Insights
Support Retest at ₹5,210:
Strong support level at ₹5,210 has been successfully retested multiple times.
Recent dip
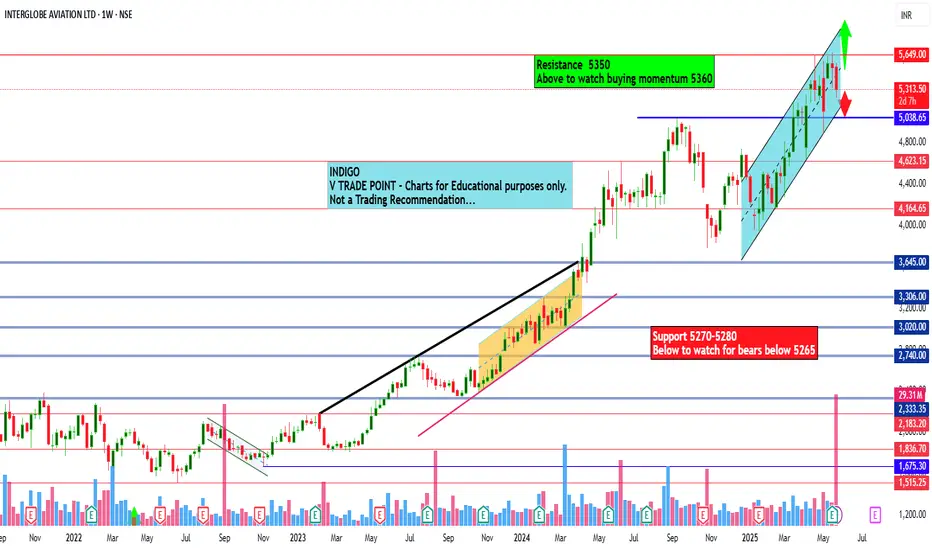
Interglobe Aviation Ltd view for Intraday 28th May #INDIGO Interglobe Aviation Ltd view for Intraday 28th May #INDIGO
Resistance 5350 Watching above 5360 for upside momentum.
Support area 5270-5280 Below 5300 ignoring upside momentum for intraday
Watching below 5265 for downside movement...
Above 5300-5310 ignoring downside move for intraday
Charts for
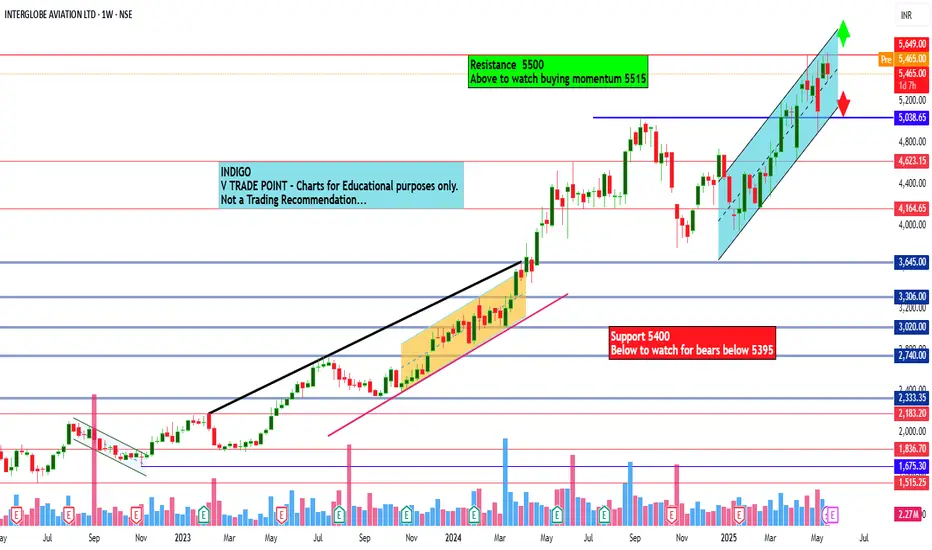
Interglobe Aviation Ltd view for Intraday 22nd May #INDIGO Interglobe Aviation Ltd view for Intraday 22nd May #INDIGO
Resistance 5500 Watching above 5515 for upside momentum.
Support area 5400 Below 5450 ignoring upside momentum for intraday
Watching below 5395 for downside movement...
Above 5450 ignoring downside move for intraday
Charts for Educationa
INDIGO - Resistance Zone with RSI Divergence| Possible Reversal?Stock is currently testing a strong resistance zone around ₹5649, which has previously acted as a supply area. Despite bullish momentum, the RSI is showing bearish divergence, as marked by red arrows, each price high is not supported by a higher RSI peak.
🔍 Key Observations:
Price is at previous s

IndiGo (InterGlobe Aviation): Breaking Out to New Highs! 🚀 IndiGo (InterGlobe Aviation): Breaking Out to New Highs! 🚀
📉 CMP: ₹5131
🔒 Stop Loss: ₹4420
🎯 Target: ₹6383
✈️ Why IndiGo Looks Promising?
🔹 All-Time High Breakout:
IndiGo is forming a rounding bottom on the weekly chart, heading towards an all-time high breakout with a monthly and weekly close


INDIGO|Buy above 4575 |SL below 4400 | 1st Target 5100, 2nd 5460Disclaimer:
This is not financial advice. Please do your own research or consult with a financial advisor before making any investment decisions. Investments in stocks can be risky and may result in loss of capital.

INDIGO SHORT TERM ANALYSISIndigo is looking reasonable, and from here on, if it gives a downside, it would become a good candidate for upside in the short to medium term . An important range to watch on the downside would be 3912-2740. We can expect a trend reversal if it crosses and sustains above 4400, and it can go up to

See all ideas
Summarizing what the indicators are suggesting.
Neutral
SellBuy
Strong sellStrong buy
Strong sellSellNeutralBuyStrong buy
Neutral
SellBuy
Strong sellStrong buy
Strong sellSellNeutralBuyStrong buy
Neutral
SellBuy
Strong sellStrong buy
Strong sellSellNeutralBuyStrong buy
An aggregate view of professional's ratings.
Neutral
SellBuy
Strong sellStrong buy
Strong sellSellNeutralBuyStrong buy
Neutral
SellBuy
Strong sellStrong buy
Strong sellSellNeutralBuyStrong buy
Neutral
SellBuy
Strong sellStrong buy
Strong sellSellNeutralBuyStrong buy
Displays a symbol's price movements over previous years to identify recurring trends.
Frequently Asked Questions
The current price of INDIGO is 5,762.00 INR — it has decreased by −0.71% in the past 24 hours. Watch INTERGLOBE AVIATION LTD stock price performance more closely on the chart.
Depending on the exchange, the stock ticker may vary. For instance, on NSE exchange INTERGLOBE AVIATION LTD stocks are traded under the ticker INDIGO.
INDIGO stock has fallen by −2.34% compared to the previous week, the month change is a 1.27% rise, over the last year INTERGLOBE AVIATION LTD has showed a 29.70% increase.
We've gathered analysts' opinions on INTERGLOBE AVIATION LTD future price: according to them, INDIGO price has a max estimate of 7,256.00 INR and a min estimate of 3,030.00 INR. Watch INDIGO chart and read a more detailed INTERGLOBE AVIATION LTD stock forecast: see what analysts think of INTERGLOBE AVIATION LTD and suggest that you do with its stocks.
INDIGO reached its all-time high on Jul 1, 2025 with the price of 6,018.00 INR, and its all-time low was 691.00 INR and was reached on Oct 9, 2018. View more price dynamics on INDIGO chart.
See other stocks reaching their highest and lowest prices.
See other stocks reaching their highest and lowest prices.
INDIGO stock is 2.18% volatile and has beta coefficient of 1.33. Track INTERGLOBE AVIATION LTD stock price on the chart and check out the list of the most volatile stocks — is INTERGLOBE AVIATION LTD there?
Today INTERGLOBE AVIATION LTD has the market capitalization of 2.24 T, it has decreased by −2.09% over the last week.
Yes, you can track INTERGLOBE AVIATION LTD financials in yearly and quarterly reports right on TradingView.
INTERGLOBE AVIATION LTD is going to release the next earnings report on Jul 30, 2025. Keep track of upcoming events with our Earnings Calendar.
INDIGO earnings for the last quarter are 79.50 INR per share, whereas the estimation was 62.81 INR resulting in a 26.56% surprise. The estimated earnings for the next quarter are 59.66 INR per share. See more details about INTERGLOBE AVIATION LTD earnings.
INTERGLOBE AVIATION LTD revenue for the last quarter amounts to 221.52 B INR, despite the estimated figure of 219.62 B INR. In the next quarter, revenue is expected to reach 208.72 B INR.
INDIGO net income for the last quarter is 30.68 B INR, while the quarter before that showed 24.49 B INR of net income which accounts for 25.27% change. Track more INTERGLOBE AVIATION LTD financial stats to get the full picture.
INTERGLOBE AVIATION LTD dividend yield was 0.20% in 2024, and payout ratio reached 5.32%. The year before the numbers were 0.00% and 0.00% correspondingly. See high-dividend stocks and find more opportunities for your portfolio.
As of Jul 28, 2025, the company has 42.89 K employees. See our rating of the largest employees — is INTERGLOBE AVIATION LTD on this list?
EBITDA measures a company's operating performance, its growth signifies an improvement in the efficiency of a company. INTERGLOBE AVIATION LTD EBITDA is 196.76 B INR, and current EBITDA margin is 24.23%. See more stats in INTERGLOBE AVIATION LTD financial statements.
Like other stocks, INDIGO shares are traded on stock exchanges, e.g. Nasdaq, Nyse, Euronext, and the easiest way to buy them is through an online stock broker. To do this, you need to open an account and follow a broker's procedures, then start trading. You can trade INTERGLOBE AVIATION LTD stock right from TradingView charts — choose your broker and connect to your account.
Investing in stocks requires a comprehensive research: you should carefully study all the available data, e.g. company's financials, related news, and its technical analysis. So INTERGLOBE AVIATION LTD technincal analysis shows the neutral today, and its 1 week rating is strong buy. Since market conditions are prone to changes, it's worth looking a bit further into the future — according to the 1 month rating INTERGLOBE AVIATION LTD stock shows the buy signal. See more of INTERGLOBE AVIATION LTD technicals for a more comprehensive analysis.
If you're still not sure, try looking for inspiration in our curated watchlists.
If you're still not sure, try looking for inspiration in our curated watchlists.