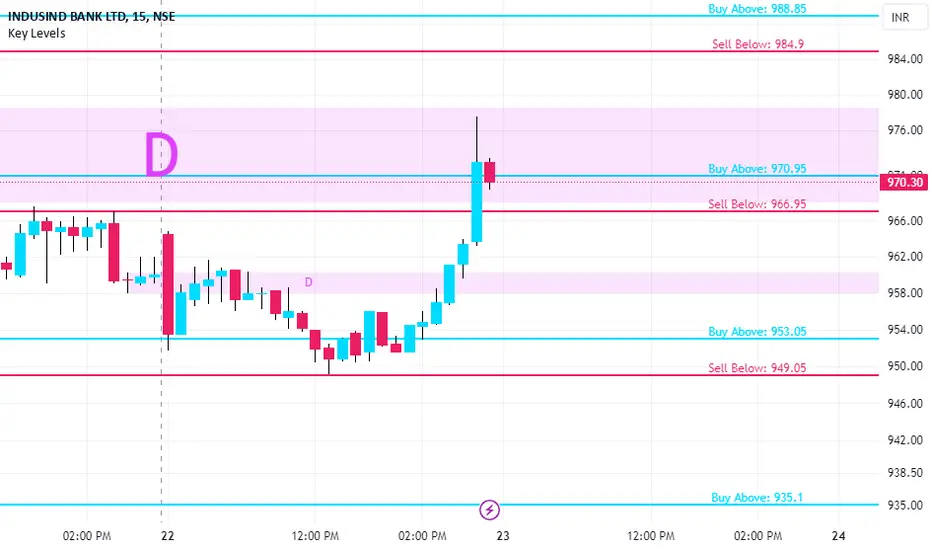
INDUSINDBK KEY LEVELS FOR 23/01/2025**Explanation:**
This trading system helps you avoid blind trades by providing confirmation for better entries and exits.
**Entry/Exit Points:**
- **Entry/Exit Lines:** Use the BLACK line for long trades and the RED line for short trades, based on confirmation from your trading plan.
- **Stop Loss:** For long trades, set the stop loss at the RED line below. For short trades, set it at the BLACK line above.
- **Take Profit:** For long trades, target the next RED line above. For short trades, target the next BLACK line below.
**Timeframe:**
Use a 5 timeframe for trading.
**Risk Disclaimer:**
This setup is for educational purposes. I'm not responsible for your gains or losses. Check the chart for more details.
INDUSINDBK trade ideas
Indusind bank 15 min TF,SWINGA short swing trade can be considered on a 15-minute candle close below 948 with good volumes.

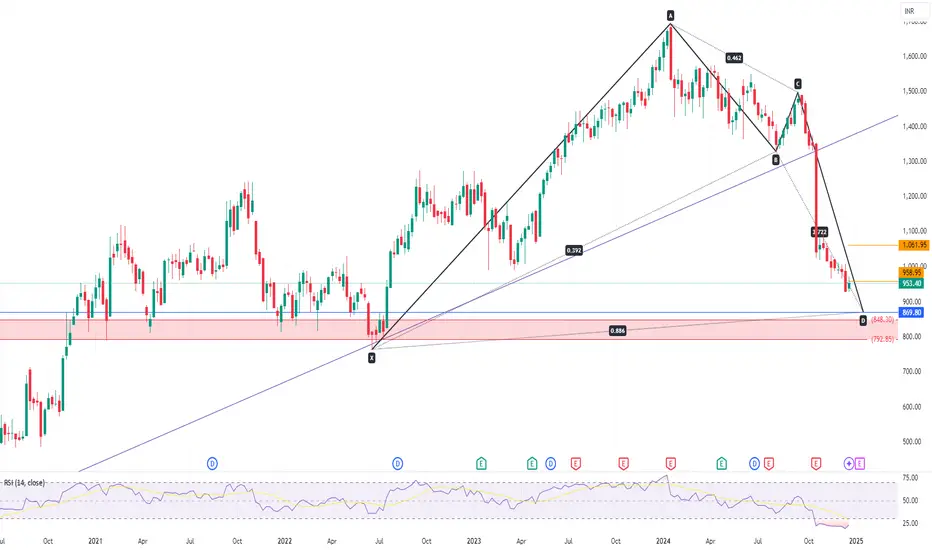
Indusindbank - Long setupIndusindbank broke trendline and reaching towards reversal zone - Half BAT & BAT Harmonic patterns.
Expected reversal at 848.30 to 869.8. Pattern will fail if price settles below 792 in weekly timeframe.
Retracement leg can reach till 960 to 1060
The Super Trade You've Been Waiting For!🚀 IndusInd Bank 🚀
This one’s set to blow your mind—IndusInd Bank is gearing up for a powerful move! 📈 The setup screams potential, and the long entry from my mark could be the game-changer you’ve been eyeing.
🔥 Why it’s exciting:
Perfect technical alignment for a breakout
Strong momentum building up on the charts
Opportunity to catch the trend early and ride the wave
💡 Pro Tip: Keep your eyes on the levels and manage your risk smartly. This could be a banger! 💥
What’s your take—ready to go long on this one? Let’s discuss!

INDUSIND BANKbotoom fishing recomended in indusind bank structure shows sellers are tired buyers are accumulating slowly gradually its time for comeback

INDUSIND BANK - Ready to go upMy conviction for this trade 8/10
Levels are lining up. Divergence. Everything seems to be in position for it to go up.
My target as marked.
I expect it to reach there within this month.

INDUSINDBK KEY LEVELS FOR 12/12/2024//@description
// All credit goes to Tony for the concept of this indicator. His Trading View link: www.tradingview.com
// Note: The calculation method in this indicator differs from Tony's, but the concept is derived from his work.
**Explanation:**
This trading system helps you avoid blind trades by providing confirmation for better entries and exits. It considers volume, past prices, price range and indiavix.
**Entry/Exit Points:**
- **Entry/Exit Lines:** Use the BLACK line for long trades and the RED line for short trades, based on confirmation from your trading plan.
- **Stop Loss:** For long trades, set the stop loss at the RED line below. For short trades, set it at the BLACK line above.
- **Take Profit:** For long trades, target the next RED line above. For short trades, target the next BLACK line below.
**Timeframe:**
Use a 5 timeframe for trading.
**Risk Disclaimer:**
This setup is for educational purposes. I'm not responsible for your gains or losses. Check the chart for more details.

INDUSIND BANK Long Identify investment opportunity in INDUSIND BANK for Longer term perspective with time span of next 5 Years. It may go to ATH in Next 3 years. So far stockcorrected 42% witness another 10-15% possible. I have start my accumulation level here will add more on 800-850 Levels which is 50% correction form recent ATH

INDUSIND INDUSIND BANK
- There is- a high chance of getting support here
- best time to start SIP
- investors should have a long-term view
CMP - 988
Stop Loss - 950
Swing Target - 1250 to 1400
Long-Term Target - All-time high
***I am not SEBI Registered.
All my charts and analyses are only for educational purposes and not for trading purposes

INDUSINDBKINDUSINDBK Chart Analysis 21/11/24..........
Long : 965 (first Sip)
Final Sip : 785
Hold & Enjoy !

INDUSIND BANK S/R Support and Resistance Levels:
Support Levels: These are price points (green line/shade) where a downward trend may be halted due to a concentration of buying interest. Imagine them as a safety net where buyers step in, preventing further decline.
Resistance Levels: Conversely, resistance levels (red line/shade) are where upward trends might stall due to increased selling interest. They act like a ceiling where sellers come in to push prices down.
Breakouts:
Bullish Breakout: When the price moves above resistance, it often indicates strong buying interest and the potential for a continued uptrend. Traders may view this as a signal to buy or hold.
Bearish Breakout: When the price falls below support, it can signal strong selling interest and the potential for a continued downtrend. Traders might see this as a cue to sell or avoid buying.
20 EMA (Exponential Moving Average):
Above 20 EMA(50 EMA): If the stock price is above the 20 EMA, it suggests a potential uptrend or bullish momentum.
Below 20 EMA: If the stock price is below the 20 EMA, it indicates a potential downtrend or bearish momentum.
Trendline: A trendline is a straight line drawn on a chart to represent the general direction of a data point set.
Uptrend Line: Drawn by connecting the lows in an upward trend. Indicates that the price is moving higher over time. Acts as a support level, where prices tend to bounce upward.
Downtrend Line: Drawn by connecting the highs in a downward trend. Indicates that the price is moving lower over time. It acts as a resistance level, where prices tend to drop.
RSI: RSI readings greater than the 70 level are overbought territory, and RSI readings lower than the 30 level are considered oversold territory.
Combining RSI with Support and Resistance:
Support Level: This is a price level where a stock tends to find buying interest, preventing it from falling further. If RSI is showing an oversold condition (below 30) and the price is near or at a strong support level, it could be a good buy signal.
Resistance Level: This is a price level where a stock tends to find selling interest, preventing it from rising further. If RSI is showing an overbought condition (above 70) and the price is near or at a strong resistance level, it could be a signal to sell or short the asset.
Disclaimer:
I am not a SEBI registered. The information provided here is for learning purposes only and should not be interpreted as financial advice. Consider the broader market context and consult with a qualified financial advisor before making investment decisions.

Indusnd Bank Ltd for Intraday 30th October #INDUSINDBK Indusnd Bank Ltd for Intraday 30th October #INDUSINDBK
Resistance 1050. Watching above 1052 for upside movement...
Support area 1030. Below 1030 ignoring upside momentum for intraday
Support 1030.Watching below 1028 for downside movement...
Resistance area 1050
Above 1050 ignoring downside move for intraday
Charts for Educational purposes only.
Please follow strict stop loss and risk reward if you follow the level.
Thanks,
V Trade Point

WHAT NEXT AFTER INDUSIND BANK CRASH?📉 IndusInd Bank’s Crash: What's Happening? 📉
Today’s massive drop in IndusInd Bank stock price has left investors stunned! The stock plummeted by over 22%, closing at ₹1,041.60, with a high at ₹1,694.50 earlier this year. With earnings missing estimates, reporting just ₹17 vs an expected ₹28.40 (a 40.14% negative surprise), the market responded aggressively. Even though revenues exceeded expectations, hitting ₹75.31B vs ₹67.653B, this wasn’t enough to prevent the crash.
Key technical levels to watch now:
📊 61.8% Fibonacci level: ₹1,035.95 – we’re right here!
📉 50% Fibonacci retracement: ₹1,138.40
💡 Support zone: ₹970-₹735 — The next key areas of interest lie between ₹970 and the 70% Fibonacci level at ₹735.05.
As the chart shows, the price is testing major long-term support areas. The question is, will this sell-off continue, or will bulls step in? Stay tuned and watch these levels closely. 💥

Indusind Bank D-W-M-Q StatusBiggest ever, one day drop more than 15% in opening Trade Today, i have shared the 4 windows with support levels and RSI ,Volume , Ema ,SMA and more.

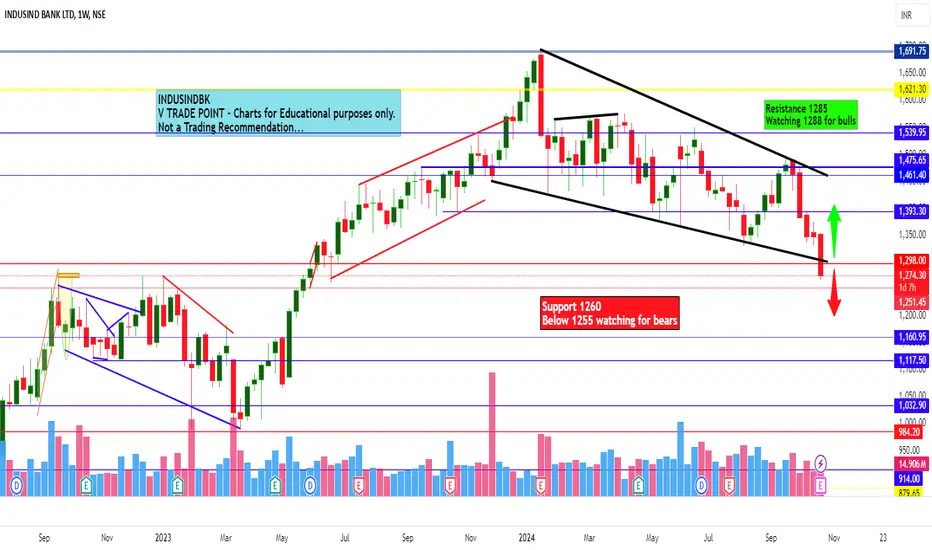
Indusnd Bank Ltd for Intraday 24th October #INDUSINDBK Indusnd Bank Ltd for Intraday 24th October #INDUSINDBK
Resistance 1285. Watching above 1288 for upside movement...
Support area 1260. Below ignoring upside momentum for intraday
Support 1260.Watching below 1255 for downside movement...
Resistance area 1285
Above ignoring downside move for intraday
Charts for Educational purposes only.
Please follow strict stop loss and risk reward if you follow the level.
Thanks,
V Trade Point
INDUSINDBK--@Near Its Demands??This stock broken the previous resistance at 1275 zone strongly,
now price is approching the same zone in a corrective manner after a long time,
we have a trendline liquidity lies above the 1500,1550 and 1579 areas.
A strong demand zone is observed at 1160 levels, these are the 2 buying zones in Indusindbank.
1 at Demand and another at Resistance zone acts as support,
if price clears the trendline liquidity from previous resistance zone acts as support zone,
then the resistance at 1700 pushes the price down then it will test the demand zone at 1150 by clears the liquidity at 1250 zone,
and then price moves higher and higher.
so look for buying oppurtunity in this stock for continuity in long direction.

Indusind Bank - Trendline SupportNSE:INDUSINDBK at major Trendline support in weekly Time Frame.
One can start accumulating slowly on seeing positive momentum from these levels. Medium term targets of Channel high can be achieved.

indusinbk buy for swing /positional
buy near 1370
avg at near 1340
sl 4% near 1315
tgt 4%8%12%16%18%
hold 4-6 week

Breakout from an inverse head & shoulders pattern on IndusindOn the daily timeframe, a breakout from an inverse head and shoulders pattern can be seen. RSI indicator also suggests a positive momentum which may help keep the trend positive in the near term.
A target of 1560 in the near term in achievable which is also a resistance. A stop loss of 1450 should be strictly maintained.

INDUSIND BANK Next Leves UpsideINDUSIND BANK seems to be moderately bullish for the next couple of months

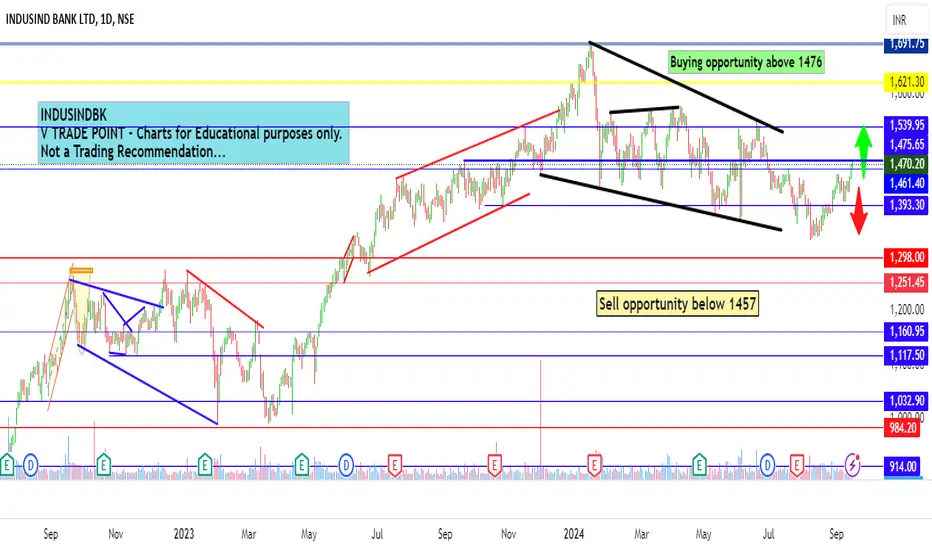
Indusnd Bank Ltd view for Intraday 17th September #INDUSINDBK Indusnd Bank Ltd view for Intraday 17th September #INDUSINDBK
Buying may witness above 1476
Support area 1457. Below ignoring buying momentum for intraday
Selling may witness below 1457
Resistance area 1476
Above ignoring selling momentum for intraday
Charts for Educational purposes only.
Please follow strict stop loss and risk reward if you follow the level.
Thanks,
V Trade Point

Flag Breakout in IndusindA technical chart pattern has emerged on the charts of Idusind Bank.
Please understand that this idea is for spreading awareness and to share my understanding of charts and technical analysis. This is not a buy/sell recommendation.
