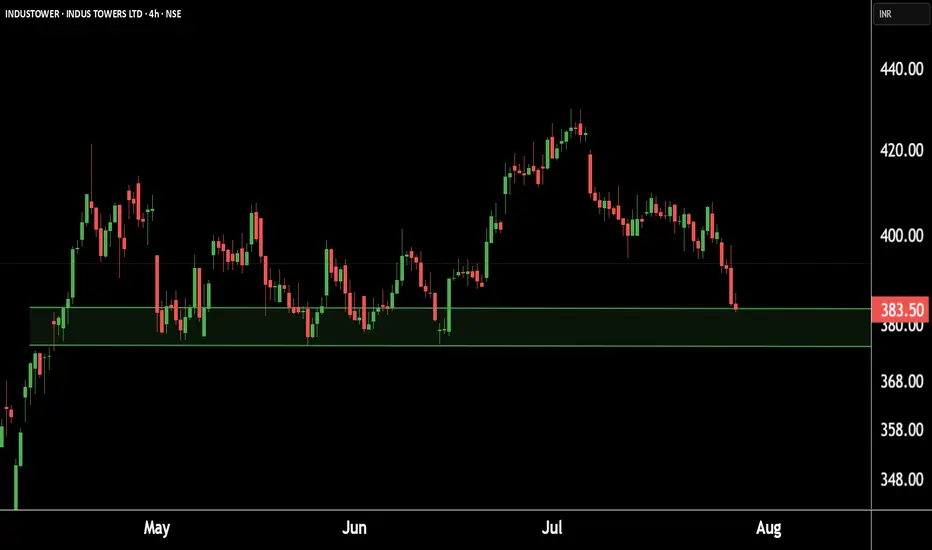
Indus Towers showing strength at key levels!Eyes on a potential.This is the 4 hour chart of INDUSTOWER.
INDUSTOWER having a good Support level near at 370-375.
if this level is sustain , then we may see higher prices in INDUSTOWER.
Thank You !!
Next report date
—
Report period
—
EPS estimate
—
Revenue estimate
—
36.80 INR
99.32 B INR
301.23 B INR
1.24 B
About INDUS TOWERS LTD
Sector
Industry
CEO
Prachur Sah
Website
Headquarters
Gurugram
Founded
2006
ISIN
INE121J01017
FIGI
BBG003CZKCD9
Indus Towers Ltd. engages in the provision of telecom tower infrastructure for telecommunication services. It operates through the Infratel and Proportionate Share of JV. The company was founded on November 30, 2006 and is headquartered in Gurugram, India.
Related stocks
INDUS TOWER - BREAKOUTNSE:INDUSTOWER Breakout stock with momentum indicators and multiple timeframe.

INDUS TOWER- BREAKOUTNSE:INDUSTOWER Monthly breakout almost 9 years consolidation breakout and retest on monthly chart. price will continue further rally from here.

Indus on the MoveIndus Towers Ltd is India’s largest telecom tower infrastructure company, operating over 220,000 towers and enabling more than 340,000 colocations across all 22 telecom circles. Backed by Bharti Airtel (holding ~50%), the company offers long-term revenue visibility, steady cash flows, and a crucial

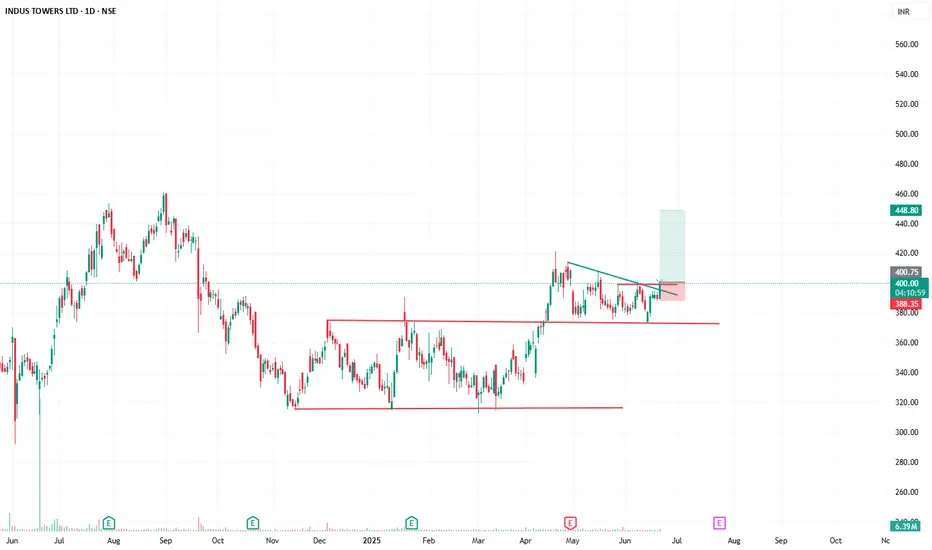
INDUSTOWER BULLISH PATTERN📡 "Tower Break! Signal Caught at ₹400"
🚀 Chart Pattern: Falling Trendline Breakout + Range Break
📈 Current Price: ₹400.25
🎯 Target: ₹448.80
🛡️ Stoploss: ₹388.15
📊 Risk:Reward ≈ 1:3.75
🔍 Volume Spike confirms breakout
🔻 Accumulation between ₹360–₹395 now acting as base
💡 Trade Setup:
After a long
INDUSTOWER at Best Support Zone !!This is the 4 hour chart of INDUSTOWER .
INDUSTOWER having good Law of Polarity at 360-370 range.
The stock is forming a Descending Triangle pattern on th L.O.P at 375 range .
If this level is sustain , then we may see higher prices in INDUSTOWER.
Thank You !!

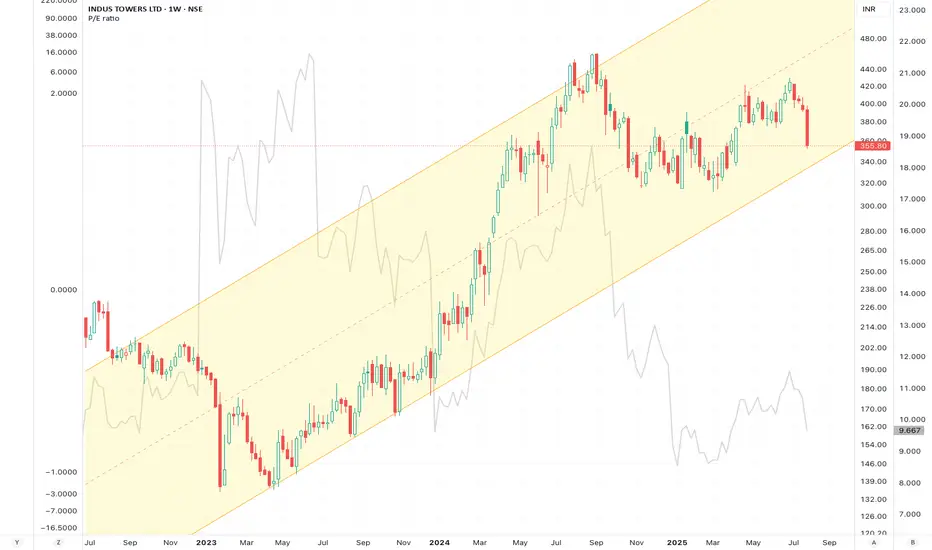
Bullish on INDUSTOWERINDUSTOWER has been in a triangular consolidation since 30th Aug 2024.
The stock corrected sharply since Sep2024 and then consolidated through the months of Nov2024 to March 2025 which is quite a considerable consolidation period.
The stock is now showing a Bullish momentum and is set to breakout.

Indus Towers Good to BUYIndus tower ( 384 ) has support at 377 and resistance at 415. With ROE @ 33 and ROCE @ 29 currently trading at 10.4 of its FY26 EPS. FII's have increase their stake. WE expect it is under valued and has potential to move to 487. Based on this factors we consider Indus tower a good to have in portfo

BUY - TGT 470Indus Tower , expected to hit the levels of 470Get your 30% returns
BUY @ 363. TGT 470.
348 is another entry level.

See all ideas
Summarizing what the indicators are suggesting.
Neutral
SellBuy
Strong sellStrong buy
Strong sellSellNeutralBuyStrong buy
Neutral
SellBuy
Strong sellStrong buy
Strong sellSellNeutralBuyStrong buy
Neutral
SellBuy
Strong sellStrong buy
Strong sellSellNeutralBuyStrong buy
An aggregate view of professional's ratings.
Neutral
SellBuy
Strong sellStrong buy
Strong sellSellNeutralBuyStrong buy
Neutral
SellBuy
Strong sellStrong buy
Strong sellSellNeutralBuyStrong buy
Neutral
SellBuy
Strong sellStrong buy
Strong sellSellNeutralBuyStrong buy
Displays a symbol's price movements over previous years to identify recurring trends.
Frequently Asked Questions
The current price of INDUSTOWER is 345.10 INR — it has decreased by −4.93% in the past 24 hours. Watch INDUS TOWERS LTD stock price performance more closely on the chart.
Depending on the exchange, the stock ticker may vary. For instance, on NSE exchange INDUS TOWERS LTD stocks are traded under the ticker INDUSTOWER.
INDUSTOWER stock has fallen by −13.40% compared to the previous week, the month change is a −17.76% fall, over the last year INDUS TOWERS LTD has showed a −20.83% decrease.
We've gathered analysts' opinions on INDUS TOWERS LTD future price: according to them, INDUSTOWER price has a max estimate of 595.00 INR and a min estimate of 300.00 INR. Watch INDUSTOWER chart and read a more detailed INDUS TOWERS LTD stock forecast: see what analysts think of INDUS TOWERS LTD and suggest that you do with its stocks.
INDUSTOWER reached its all-time high on Aug 5, 2015 with the price of 499.65 INR, and its all-time low was 120.05 INR and was reached on Mar 19, 2020. View more price dynamics on INDUSTOWER chart.
See other stocks reaching their highest and lowest prices.
See other stocks reaching their highest and lowest prices.
INDUSTOWER stock is 5.92% volatile and has beta coefficient of 1.06. Track INDUS TOWERS LTD stock price on the chart and check out the list of the most volatile stocks — is INDUS TOWERS LTD there?
Today INDUS TOWERS LTD has the market capitalization of 910.11 B, it has increased by 0.66% over the last week.
Yes, you can track INDUS TOWERS LTD financials in yearly and quarterly reports right on TradingView.
INDUS TOWERS LTD is going to release the next earnings report on Oct 27, 2025. Keep track of upcoming events with our Earnings Calendar.
INDUSTOWER earnings for the last quarter are 6.59 INR per share, whereas the estimation was 6.99 INR resulting in a −5.70% surprise. The estimated earnings for the next quarter are 6.99 INR per share. See more details about INDUS TOWERS LTD earnings.
INDUS TOWERS LTD revenue for the last quarter amounts to 80.58 B INR, despite the estimated figure of 80.92 B INR. In the next quarter, revenue is expected to reach 82.32 B INR.
INDUSTOWER net income for the last quarter is 17.37 B INR, while the quarter before that showed 17.79 B INR of net income which accounts for −2.38% change. Track more INDUS TOWERS LTD financial stats to get the full picture.
INDUS TOWERS LTD dividend yield was 0.00% in 2024, and payout ratio reached 0.00%. The year before the numbers were 0.00% and 0.00% correspondingly. See high-dividend stocks and find more opportunities for your portfolio.
As of Aug 2, 2025, the company has 3.79 K employees. See our rating of the largest employees — is INDUS TOWERS LTD on this list?
EBITDA measures a company's operating performance, its growth signifies an improvement in the efficiency of a company. INDUS TOWERS LTD EBITDA is 206.90 B INR, and current EBITDA margin is 69.20%. See more stats in INDUS TOWERS LTD financial statements.
Like other stocks, INDUSTOWER shares are traded on stock exchanges, e.g. Nasdaq, Nyse, Euronext, and the easiest way to buy them is through an online stock broker. To do this, you need to open an account and follow a broker's procedures, then start trading. You can trade INDUS TOWERS LTD stock right from TradingView charts — choose your broker and connect to your account.
Investing in stocks requires a comprehensive research: you should carefully study all the available data, e.g. company's financials, related news, and its technical analysis. So INDUS TOWERS LTD technincal analysis shows the strong sell today, and its 1 week rating is sell. Since market conditions are prone to changes, it's worth looking a bit further into the future — according to the 1 month rating INDUS TOWERS LTD stock shows the neutral signal. See more of INDUS TOWERS LTD technicals for a more comprehensive analysis.
If you're still not sure, try looking for inspiration in our curated watchlists.
If you're still not sure, try looking for inspiration in our curated watchlists.