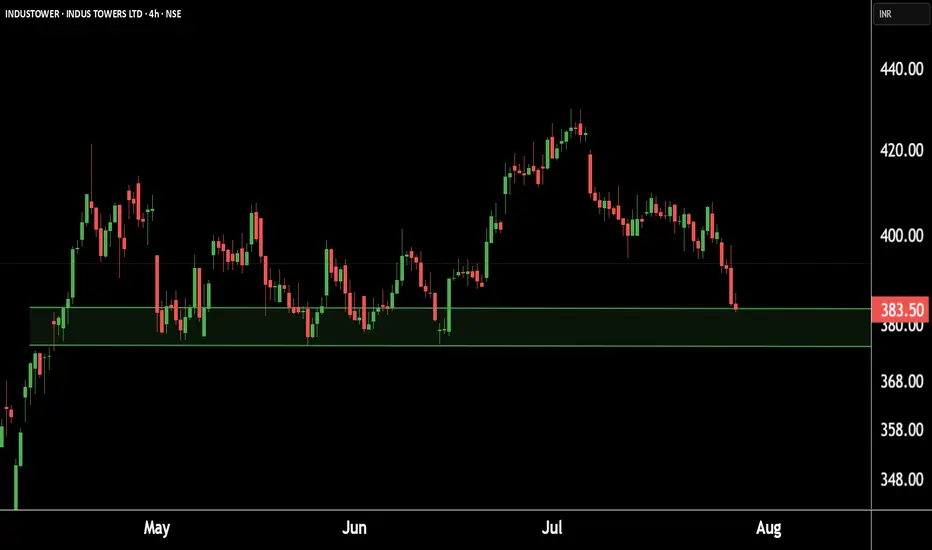
Indus Towers showing strength at key levels!Eyes on a potential.This is the 4 hour chart of INDUSTOWER.
INDUSTOWER having a good Support level near at 370-375.
if this level is sustain , then we may see higher prices in INDUSTOWER.
Thank You !!
INDUSTOWER trade ideas
INDUS TOWER - BREAKOUTNSE:INDUSTOWER Breakout stock with momentum indicators and multiple timeframe.

INDUS TOWER- BREAKOUTNSE:INDUSTOWER Monthly breakout almost 9 years consolidation breakout and retest on monthly chart. price will continue further rally from here.

Indus on the MoveIndus Towers Ltd is India’s largest telecom tower infrastructure company, operating over 220,000 towers and enabling more than 340,000 colocations across all 22 telecom circles. Backed by Bharti Airtel (holding ~50%), the company offers long-term revenue visibility, steady cash flows, and a crucial position in India’s telecom value chain—especially as the country rapidly expands its 5G infrastructure.
In Q4 FY25, the company reported a standalone revenue of ₹7,727 crore, up 7.4% year-on-year. Consolidated revenue also rose to ₹7,547 crore. Net profit margins remain robust at around 33%, while the return on equity (ROE) stands strong at 30–33%. Operating efficiency is also reflected in the return on capital employed (ROCE), which is approximately 28.6%.
Liquidity remains healthy, with ₹33.4 billion in cash and short-term investments, positive working capital of ₹31.4 billion, and operating cash flow of ₹11,582 crore in FY2024. The company has a manageable debt-to-equity ratio of ~0.65 and net debt around ₹178 billion. Valuation metrics are attractive: a price-to-earnings (P/E) ratio near 10.8x and EV/EBITDA of ~5.6x suggest the stock is undervalued relative to its cash-generating strength. The Piotroski F-score of 7–8 reflects solid financial health.
Overall, the fundamentals indicate that Indus Towers is a stable, cash-rich business with long-term growth potential linked to telecom and data consumption growth in India.
📉 Technical Outlook
The 2-hour chart reflects a significant breakout pattern. A long-standing descending trendline has acted as dynamic resistance since April, repeatedly pushing the price lower. However, recent price action shows a strong breakout above this trendline, accompanied by bullish candles and higher volume.
The reversal zone between ₹388–392 acted as a key support area where buyers stepped in. The breakout above this zone followed by a push beyond the ₹404–408 zone signals strong upside momentum.
Key levels to monitor:
Close Above ₹408: Confirms the breakout and initiates bullish momentum.
Resistance Targets: ₹424 (R1), ₹438 (R2), and ₹462 (R3).
Support Zone: ₹388–392 remains a demand area. A move below this may invalidate the setup.
The pattern suggests a shift from lower highs to potential higher highs, which can attract swing and positional traders.
✅ Conclusion
Indus Towers is a classic case where fundamentals and technicals align. On one hand, it boasts strong earnings, consistent cash flow, low valuation, and strategic importance in India’s 5G rollout. On the other, the recent breakout from a long-term resistance trendline shows a potential trend reversal on the chart.
For investors and traders, this confluence presents a compelling opportunity. An entry in the ₹404–408 range could yield solid returns, with targets at ₹424, ₹438, and ₹462. A stop-loss below ₹388 is advisable to manage risk.
Disclaimer: lnkd.in

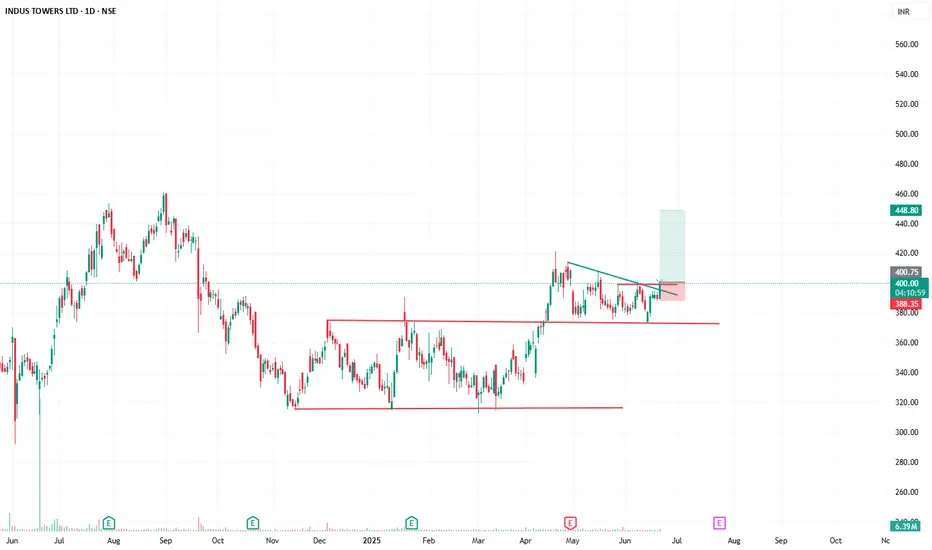
INDUSTOWER BULLISH PATTERN📡 "Tower Break! Signal Caught at ₹400"
🚀 Chart Pattern: Falling Trendline Breakout + Range Break
📈 Current Price: ₹400.25
🎯 Target: ₹448.80
🛡️ Stoploss: ₹388.15
📊 Risk:Reward ≈ 1:3.75
🔍 Volume Spike confirms breakout
🔻 Accumulation between ₹360–₹395 now acting as base
💡 Trade Setup:
After a long consolidation in a rectangular range, the price has broken out of both horizontal and descending resistance lines with strong volume. The price is above the breakout zone and retesting the level.
INDUSTOWER at Best Support Zone !!This is the 4 hour chart of INDUSTOWER .
INDUSTOWER having good Law of Polarity at 360-370 range.
The stock is forming a Descending Triangle pattern on th L.O.P at 375 range .
If this level is sustain , then we may see higher prices in INDUSTOWER.
Thank You !!

Bullish on INDUSTOWERINDUSTOWER has been in a triangular consolidation since 30th Aug 2024.
The stock corrected sharply since Sep2024 and then consolidated through the months of Nov2024 to March 2025 which is quite a considerable consolidation period.
The stock is now showing a Bullish momentum and is set to breakout.
We can anticipate a Target of 421 price level in the near term.
P.S. Not a Recommendation. Pls do your own due diligence.

Indus Towers Good to BUYIndus tower ( 384 ) has support at 377 and resistance at 415. With ROE @ 33 and ROCE @ 29 currently trading at 10.4 of its FY26 EPS. FII's have increase their stake. WE expect it is under valued and has potential to move to 487. Based on this factors we consider Indus tower a good to have in portfolio.

BUY - TGT 470Indus Tower , expected to hit the levels of 470Get your 30% returns
BUY @ 363. TGT 470.
348 is another entry level.

Pre-momentum stocks be identified in trading viewWhich indicator in trading view very precisely identifies pre-momentum bullish trend of a stock that would yield 5 to 10% of price rise in next couple of trading sessions .

Industower updated chartIndustower updated chart it can go upto 1.618 level as looking butterfly pattern

INDUSTOWERINDUSTOWER, watch below levels on chart.
DISCLAIMER : I am NOT a SEBI registered advisor or a financial adviser. All the views are for educational purpose only.

INDUSTOWER
Overall Trend:
Upward Trend: The green lines suggest an overall upward trend in the stock's price. This means the price has been generally increasing over the period shown.
Price Movement:
Volatility: The price has experienced significant fluctuations, with periods of sharp rises and falls. This is indicated by the vertical lines, which represent the price at different points in time.
Support and Resistance: The green and red lines might represent support and resistance levels. Support levels are price points where the price tends to find support and stop falling. Resistance levels are price points where the price tends to encounter resistance and stop rising.
Technical Analysis:
This chart is likely used for technical analysis, which involves studying past price and volume data to predict future price movements. Technical analysts use various tools and indicators (like the lines and boxes in this chart) to identify patterns and make trading decisions.
Disclaimer: This is a basic interpretation of the chart. Technical analysis is complex, and interpreting charts requires expertise and experience.

INDUSTOWERS -- looking bullishINDUSTOWERS -- looking bullish With Year on Year & QoQ increased Earnings with DOUBLE BOTTOM AND SPRING pattern developing on charts - looking for a bullish trades

INDUS TOWERS LTD S/R Support and Resistance Levels:
Support Levels: These are price points (green line/shade) where a downward trend may be halted due to a concentration of buying interest. Imagine them as a safety net where buyers step in, preventing further decline.
Resistance Levels: Conversely, resistance levels (red line/shade) are where upward trends might stall due to increased selling interest. They act like a ceiling where sellers come in to push prices down.
Breakouts:
Bullish Breakout: When the price moves above resistance, it often indicates strong buying interest and the potential for a continued uptrend. Traders may view this as a signal to buy or hold.
Bearish Breakout: When the price falls below support, it can signal strong selling interest and the potential for a continued downtrend. Traders might see this as a cue to sell or avoid buying.
MA Ribbon (EMA 20, EMA 50, EMA 100, EMA 200) :
Above EMA: If the stock price is above the EMA, it suggests a potential uptrend or bullish momentum.
Below EMA: If the stock price is below the EMA, it indicates a potential downtrend or bearish momentum.
Trendline: A trendline is a straight line drawn on a chart to represent the general direction of a data point set.
Uptrend Line: Drawn by connecting the lows in an upward trend. Indicates that the price is moving higher over time. Acts as a support level, where prices tend to bounce upward.
Downtrend Line: Drawn by connecting the highs in a downward trend. Indicates that the price is moving lower over time. It acts as a resistance level, where prices tend to drop.
Disclaimer:
I am not a SEBI registered. The information provided here is for learning purposes only and should not be interpreted as financial advice. Consider the broader market context and consult with a qualified financial advisor before making investment decisions.

$INDUSTOWER respecting weekly demandsNSE:INDUSTOWER respecting weekly demands. a reversal here will get us to ATH. given market conditions this could pan out well. looking at 8R opportunity

INDUS TOWER LTD GOING TO UPTRENDThis chart is only study purpose only take your decision through your mentor

INDUSTOWER LONGBREAKOUT AND RETEST
Resistance Level - 450 - 475
Support Level - 290 - 310
View is negated with a close below 285.
Good pick for short term and long term.
My view is for educational or study purpose only.
It is not a buy/sell recommendation.
Contact your financial advisor before taking any investment or trade decision.

Indus Towers Ltd view for Intraday 6th Dec #INDUSTOWER Indus Towers Ltd view for Intraday 6th Dec #INDUSTOWER
Resistance 370. Watching above 371 for upside movement...
Support area 360 Below 365 ignoring upside momentum for intraday
Support 360 Watching below 358 for downside movement...
Resistance area 370
Above 365 ignoring downside move for intraday
Charts for Educational purposes only.
Please follow strict stop loss and risk reward if you follow the level.
Thanks,
V Trade Point

Investment IdeaIndus Towers Financial Highlights
1. Current Market Price (CMP): ₹326.2
2. Price-to-Earnings (P/E) Ratio: 11.65
3. Market Capitalization: ₹87,908.84 crores
4. Dividend Yield: 0%
5. Net Profit (Qtr): ₹2,223.5 crores (71.74% YoY growth)
6. Sales (Qtr): ₹7,465.3 crores (4.67% YoY growth)
Performance Indicators
1. Return on Capital Employed (ROCE): 22.08%
2. Promoter Holding: 53%
3. Relative Strength Index (RSI): 27.94 (oversold/undervalued)
Indus Towers competing with:
1. Bharti Infratel
2. Reliance Infratel
3. GTL Infrastructure
Key Takeaways
- Strong net profit growth 71.74% YoY
- Moderate sales growth 4.67% YoY
- Attractive P/E ratio 11.65
- High promoter holding 53%
- Undervalued RSI 27.94
Last Trading Price: 326
Buy Range: Rs 320-330
Short-Term Targets: Rs 356, 396, 436
Long-Term Targets: Rs 436, 526, 636
Accumulation Zone: Rs 290-270 (buy on dips)

IT IS TIME TO ENTER INDUS TOWEREverything is pretty much explained in the picture itself.
I am Abhishek Srivastava | SEBI-Certified Research and Equity Derivative Analyst from Delhi with 4+ years of experience.
I focus on simplifying equity markets through technical analysis. On Trading View, I share easy-to-understand insights to help traders and investors make better decisions.
Kindly check my older shared stock results on my profile to make a firm decision to invest in this.
For any query kindly dm.
Thank you and invest wisely.

INDUS TOWER THREE SUPPORT U CAN BUY THIS BEST PRICEIndus Towers Limited is engaged in the business of object of, inter-alia, setting up, operating and maintaining wireless communication towers
