INFY trade ideas

INFOSYS LTD. BUY ABOVE- 920 & SHORT BELOW-891ONLY EDUCATION PURPOSE PLEASE TRADE WITH YOUR OWN RISK.
BUY ABOVE 920
SHORT BELOW- 891
PLEASE PROVIDE YOUR VALUABLE FEEDBACK'S TO IMPROVE & EDUCATE MYSELF.

Infosys AnalysisDetails are drawn in the Chart
Black doted line act as a S & R
if u find the analysis nice than hit the like button & thanks for comments.


Short INFY If Breaks 775.5, Target 1: 770, Target2: 765 SL 781Short INFY If Breaks 775.5, Target 1: 770, Target2: 765 SL 781

Infosys ShortShort till 780 as per Wave 4 formation will start soon so it may come down.
If break the high on closing basis close the trade

infy resistanceinfy has lot of supply coming in at 815 and 847, those two deep probing bars (arrow mark) collected huge quantity at lower levels.

Pair - Bearish Infy vs TCSThe pair ratio has hit the resistance level - slightly downward sloping trendline of highs in last 2-3 years
Similarly, RSI has also hit the resistance level.
Good level for reversion towards 0.360

NYSE to NSE INFY is this a manipulation or coincidental one ?Lets start this idea with hits at the Likes and with your comments . I am sure you love this .
I wish to share a deep but very simple analysis where INFY was exactly following NYSE previous day OPEN Close High price to current day NSE INFY chart . It looks to be a big player Manipulation .
Once had sensed it would have made good entry and exit .
Please find the Big Player action in Market .
Two chart i have given below one is yesterday 4H chart circled once from New York exchange for INFY.
Today the same play happened here at our India Stock Market NSE.
It shows there is a big players who is manipulating the market exactly the same ways but a day apart each time.
Take the circled price of OPEN High Low Close(14th July) (NYSE market ) multiply that price with 75.20 USD that will almost match with NSE INFY price of 15th July 2020.


INFOSYS Price DevelopmentINFOSYS
(NSE: INFY)
Oct 2018 - Oct 2019 | Price moving UP
(1) Gap DOWN | Trendline Breakout, DOWNSIDE
Oct 2019 - Feb 2020 | Price moving UP
(2) Gap DOWN | Trendline Breakout, DOWNSIDE
Feb 2020 - July 2020 | Price moving UP
(3) Gap UP | Trendline Breakout, UPSIDE
(on 15 July 2020, yesterday)

Infosys make new 52 highTomarrow i give analysis in moneycontrol.com that Infosys make new 52 week high and cross , today it make new 52wk high, see my chart it may trade in between 1050 to 860 in near term

INFYNSE:INFY
Results are around, and the OI addition seems to be on higher side in the ITM options which is suggesting further upside.
Entry above 806, if sustains then can see 813 and 823. Sl would be 799.50
**********************************************************************************************************************************************
Hi all,
Its pleasure to have you all here.
I have started putting these charts as a contribution from my side to all people who are new to business, as I had to struggle a lot without any sources at disposal. So please consider this a just small contribution from my side.
Few Honest Disclosures:
1. Any idea shared is my personal view, its not a recommendation, neither any kind of paid propaganda, so please
do your bit of research.
2. Ideas shared does not mean that I trade all or have position in them, this is just a helping hand to all.
3. I expect no comments or like nor any negativity, as I said its just a small helping hand from my side, please plan your risk and trade as per your capacity.
4. To trade in Cash, options or futures is your sole choice and your own risk
5. I am no expert in Tech Indicators, I believe in support resistance and trendline theory, you may use this as a supplement theory for better results.
6. I work for my own living, this is a hobby which I do sincerely to help anyone who might come across my charts.
***********************************************************************************************************************************************


INFY - Currently struggling in supply zoneNSE:INFY only take position once it breaks & closes on either side.

Infosys perfect cup-handle with 50 EMA breakout at pivot levelThe reasons why I choose this trade.
1. Cup & handle formation
2. 50 EMA, 14 EMA & Pivot breakout together
3. Shorterm trend break
4. On daily chart it is ascending triangle.
All above is happening at multiple day support which is at 697. So 697 is very crucial at this time. Once it break, higher upside is possible.

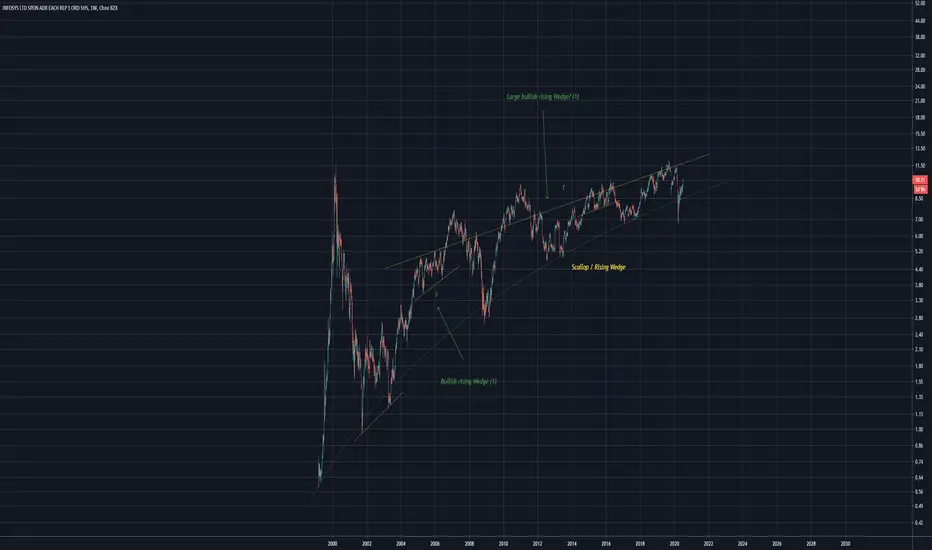
INFY Scallop + bullish rising wedge?Normally rising wedges are bearish but i believe in this case it will act bullishly and momentum will carry price upwards.
Sick and tired of these scallops haha

Infy - Pennant BreakoutInfy has Pennant breakout followed by triangle breakout and also retraced at golden ration... Will boom above 765.. Target on chart


MY VIEW FOR INFUSES BUSINESS BOOMING!!!!!LEVELS AND TARGETS FOR INFUSES AS PER CHARTS!! I'M BULLISH ON IT STOCKS!! LET'S GO
HAHAHAHAHAHAHAHHAHAHAHAHAH

$INFY Infosys Trade setup
Possible long above the 200ma
Upside target to long term Downtrend
MACD reversing
