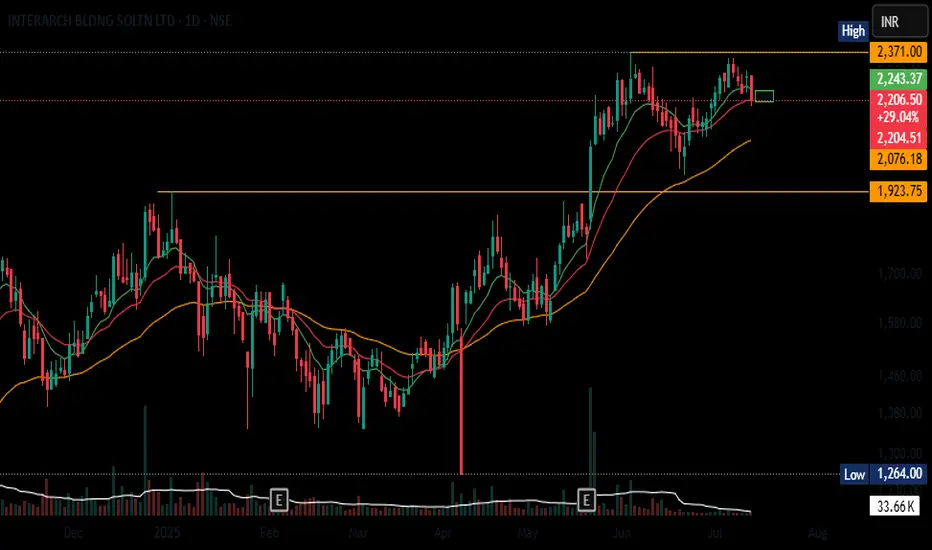
INTERARCH PULLBACK Clean break above prior resistance (₹2,371), now consolidating - A typical retest zone around breakout. Uptrend remains intact
INTERARCH trade ideas
Interarch Building Products Ltd: Long Positional Trade IdeaCurrently trading at ₹1,817, Interarch is showing strong upward momentum on the daily chart after a recent breakout.
Key Observations:
Support Levels: Strong support at ₹1,700, with a secondary base near ₹1,550.
Resistance Levels: Immediate resistance near ₹1,900, with potential to test ₹2,050-2,100 in the coming weeks.
Indicators:
RSI at 63.70, indicating bullish momentum without being overbought.
Sustained volume spike confirms breakout strength.
Strategy:
Entry: On a pullback near ₹1,800 or a breakout above ₹1,900.
Targets: ₹2,000 (short term), ₹2,100 (positional).
Stop-Loss: Below ₹1,690 to manage risk effectively.
Focus on volume confirmation for sustained upside!

INTERARCH, successsfully traded.Teachings of My guru Mark Minervini , 2 times US Investing champion applied successfully in a falling Indian stock markets, still turned out profitable.

INTERARCH BUILDING PROD LTD S/RSupport and Resistance Levels:
Support Levels: These are price points (green line/shade) where a downward trend may be halted due to a concentration of buying interest. Imagine them as a safety net where buyers step in, preventing further decline.
Resistance Levels: Conversely, resistance levels (red line/shade) are where upward trends might stall due to increased selling interest. They act like a ceiling where sellers come in to push prices down.
Breakouts:
Bullish Breakout: When the price moves above resistance, it often indicates strong buying interest and the potential for a continued uptrend. Traders may view this as a signal to buy or hold.
Bearish Breakout: When the price falls below support, it can signal strong selling interest and the potential for a continued downtrend. Traders might see this as a cue to sell or avoid buying.
MA Ribbon (EMA 20, EMA 50, EMA 100, EMA 200) :
Above EMA: If the stock price is above the EMA, it suggests a potential uptrend or bullish momentum.
Below EMA: If the stock price is below the EMA, it indicates a potential downtrend or bearish momentum.
Trendline: A trendline is a straight line drawn on a chart to represent the general direction of a data point set.
Uptrend Line: Drawn by connecting the lows in an upward trend. Indicates that the price is moving higher over time. Acts as a support level, where prices tend to bounce upward.
Downtrend Line: Drawn by connecting the highs in a downward trend. Indicates that the price is moving lower over time. It acts as a resistance level, where prices tend to drop.
Disclaimer:
I am not a SEBI registered. The information provided here is for learning purposes only and should not be interpreted as financial advice. Consider the broader market context and consult with a qualified financial advisor before making investment decisions.

Interarch builder: IPO base breakout attempted after bottomInterarch Builder: did a ipo day high breakout attempt of 1318 and made a new 52 wk high of 1338.
after results selling was seen and after that it bounced back again.
if 1315 is broken again we will see 1400-1500 in short term.
Gave revenue double guideline in next 3 years and stock pe is undervalued.
Disclaimer: only for education purposes, no buy or sell recommendation. we are not sebi registered. always discuss first with your financial advisors
