Go long in IOCWe have seen a clear breakout of inverted H&S pattern in IOC share. From here, we can expect targets of 154,160,165 & 174 on weekly frame. Stoploss against this investment can be placed near 145.
IOC trade ideas
Buy IOC short term target 155, 165 & Medium Term tgt 185, 250 Indian Oil Corporation does business in the entire hydrocarbon value chain - from Refining, Pipeline transportation and marketing of Petroleum products to R&D, Exploration & production, marketing of natural gas and petrochemicals. It has the leadership position in the Oil refining & petroleum marketing sector of India.
The company aims to strengthen EV mobility infrastructure by setting up charging points and battery-swapping facilities at its fuel stations. It has also signed a binding term sheet with Panasonic Group to form a JV for manufacturing cells in India.
The company’s R&D is focused on emerging fields such as nanotechnology, Solar, Bioenergy, Hydrogen, etc. It has an effective patent portfolio of 1636. It spent Rs 946 Cr in FY24 on R&D.
The company’s R&D is focused on emerging fields such as nanotechnology, Solar, Bioenergy, Hydrogen, etc. It has an effective patent portfolio of 1636. It spent Rs 946 Cr in FY24 on R&D.
Market Cap ₹ 2,07,370 Cr.
Annual Sales - ₹ 758,106 Cr
Dividend Yield - 8.20 %
Stock P/E - 17.0
Industry PE - 29.2
Debt to equity - 0.82
ROCE - 7.37 %
EPS - ₹ 9.63
Fundamentally, this big company is trading at a very low valuation. The Crude Oil price is expected this year to be on lowest, so we can expect good profit margin and this company is into green energy business so it should have PE multiple of that business as well. We Expect growth in EPS by 30% to 12.5 And re-rating of PE multiple to 20 so that give the share price to ₹ 250 which gives return of 70.88% from current price level of 146.30.
Technically, this is very bullish on weekly, daily timeframe. Price is trading above all short term, medium term averages. It has formed a bullish candlestick pattern on daily and weekly chart, so we expect immediate strong upside to 155, 165 and eventually 185 level and investment target of 250 levels.

IOCL BuyIndian Oil is taking support at the trend line. Buy @CMP (148) with SL of 135 and target of 160-180.
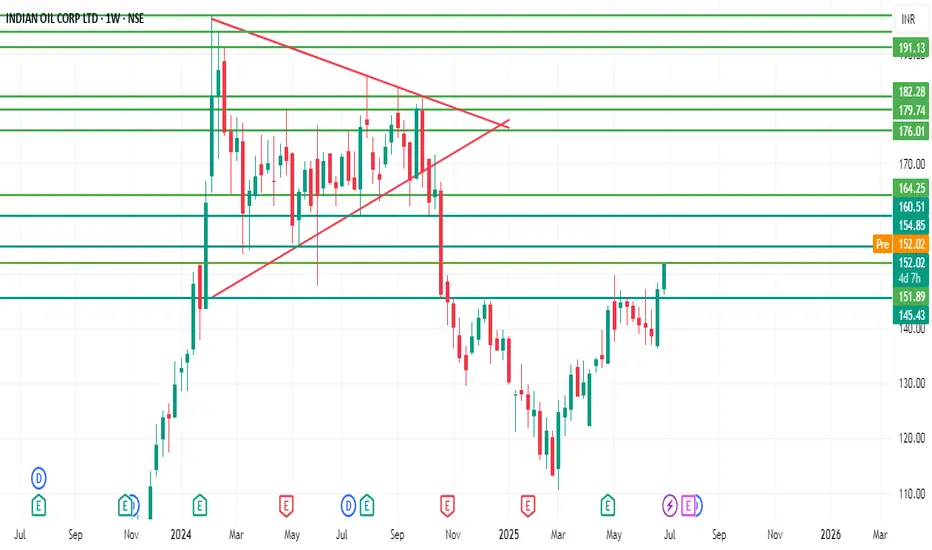
IOC - Update We had a look at this chart earlier when it moved above the short term moving averages and 200 DMA set up for good move. Now we can see a nice Contraction pattern. The spring is being compressed for a good explosive move. This will be an interesting chart to watch...

IOC The red horizontal line on the chart represents the resistance zone, which is around ₹145.
In the past, the stock price has stalled at this level multiple times – indicating that it's a strong resistance level.
This time, the stock has attempted to break through this resistance, which is a positive (bullish) signal.
If you find this helpful and want more FREE forecasts in TradingView, Hit the 'BOOST' button
Drop some feedback in the comments below! (e.g., What did you find most useful?
How can we improve?)
Your support is appreciated!
Now, it's your turn!
Be sure to leave a comment; let us know how you see this opportunity and forecast.
Have a successful week
DISCLAIMER: I am NOT a SEBI registered advisor or a financial adviser. All the views are for educational purpose only

Indian oil Corporation (IOC)market is in uptrend and As you see bullish engulfing candlestick form above support level. Simply it's a buy.
it is for educational purpose only before buying do your own research.
My chart doesn't have lots of indicators. if you found something missing kindly comment and tell my fault please.

IOCIOC
watch above levels. green line is our entry, redline is our SL.
DISCLAIMER : I am NOT a SEBI registered advisor or a financial adviser. All the views are for educational purpose only.

TIME TO AVERAGE YOUR POSITIONS - IOCEverything is pretty much explained in the picture itself.
I am Abhishek Srivastava | SEBI-Certified Research and Equity Derivative Analyst from Delhi with 4+ years of experience.
I focus on simplifying equity markets through technical analysis. On Trading View, I share easy-to-understand insights to help traders and investors make better decisions.
Kindly check my older shared stock results on my profile to make a firm decision to invest in this.
For any query kindly dm.
Thank you and invest wisely.

Indian Oil LongThe Stock Indian Oil has gone through a Massive Correction and now its trying to hold upon its Long Term Support which was a Resistance when the Price Broke that level of 117 on 4th Dec , 2024 and now again after a year the price is again at that exact level and since few trading days the price is holding over that level and indicating good Buying Strength from that Zone.
Remember : "Be fearful when others are greedy, and be greedy when others are fearful"

NSE IOC – Approaching a Key Demand ZoneTimeframe: Daily
After reaching a high of 196.8, the price has declined by over 39% in 13 weeks. It is currently trading below the 50/100 EMA band, with ATR at 3.68 and ADX at 26.02 . According to the Elliott Wave projection, the peak of 196.80 can be identified as a wave ((3)). The security is currently undergoing the formation of a corrective wave (4).
Wave (B) formed at 185.97 , while wave 4 of wave (C) was completed at 145.10 . NSE IOC is now setting up for the final wave 5 of wave (C).
Two key Fibonacci relationships help estimate the end of the correction:
1.618 Fibonacci extension of wave (A) at 106.54 (for wave C)
0.618 Fibonacci extension of wave 1 at 115.52 (for wave 5)
The price is expected to settle between 115 and 105 , which serves as a key demand zone for buyers. If the price breaks out and sustains above 129.75, traders can target the following levels: 139 – 156 – 172+.
we will update further information soon.

Indian Oil Here’s a detailed company profile for **Indian Oil Corporation Limited (IOCL)**:
---
### **Company Overview**
**Indian Oil Corporation Limited (IOCL)**, often referred to as **Indian Oil**, is India’s largest commercial oil company and one of the leading energy providers globally. It is a public sector undertaking (PSU) under the ownership of the **Ministry of Petroleum and Natural Gas, Government of India**.

IOC Positioned for Significant Upside Potential: Projected 10%+ Indian Oil Corporation (IOC) has recently experienced a reversal from a well-established support level, accompanied by a notable surge in trading volume, which suggests the potential for continued bullish momentum. Currently, the price is approaching a critical trendline on the daily chart. A breakout above this trendline could signal a significant reversal and drive further upward movement in the coming months. Alternatively, if the price fails to break through, it may retrace to test the support level once more before resuming its bullish trajectory. This scenario presents a pivotal moment for IOC, with both outcomes warranting close observation for informed decision-making.
This information is provided solely for educational purposes and should not be used as the basis for any trading decisions.

IOC LONGIOC
MTF Analysis
IOCYearly Demand 134
IOC 6 Month Demand Breakout 197
IOCQtrly Demand Breakout 197
IOCMonthly Demand
IOCWeekly Demand 172
IOCDaily Demand DMIP 165
ENTRY -1 172
SL 163
RISK 9
Potential Target 205
First Target Points 184
First recovery Target Points 21
Last Swing Low 163
Last Swing High 184
RR 2
RR 19%

Respect or Break: The Big QuestionWill the trendline hold? What do you think?
The trend looks promising and with a strong positive trend in the market, this might be the right time to add IOC to the portfolio.

IOC Swing Trade IOC COuld Go Long . Ioreover after reaching its All time High Indian Oil got corrected to 163 after reaching 183.89 . The reason for its correction was multiple and since then Investors are waiting for a long time for it to correct and then come back on track so that Investors can Invest in this Fundamentally strong Company .
The Stock took support at 163.16 and after that it formed a Bullish Price Action indicating a trend reversal towards Uptrend . After Holding a Level of 165 and reaching and holding at 166-167 Level on 20th September 2024, The stock showed a powerful Bullish sentiment and now it could reach to upper areas Like 167 , 168.93 , 176.96, 173.49 and 174.47
This Trade Analysis is only for Educational Purpose . I am Not SEBI Registered and I am not sharing any Trade Idea or Recommendation . Trade or Invest according to your own Analysis.

Dividend Paying Stock - Long TermI am not a Sebi registered adviser.
This Idea is publish purely for educational purpose only before investing in any stocks please take advise from your financial adviser.
This is One of the Dividend Paying Stock for Long Term Investors and Right Now in Good Position to take Entry.
Always take entry near the Support to Moving average.
Be Discipline because discipline is the Key to Success in the STOCK Market.

Technical Analysis of Indian Oil Corporation Ltd (IOC)Technical Analysis of Indian Oil Corporation Ltd (IOC)
Overview of the Stock - The chart shows a 4-hour candlestick chart of Indian Oil Corporation Ltd (IOC) on the National Stock Exchange (NSE) of India. The analysis is based on technical indicators like moving averages (EMA) and relative strength index (RSI) along with support and resistance levels.
Key Observations
Price Action: The price of IOC has been fluctuating, with a recent decline.
EMA (200, high): The price is currently below the 200-day exponential moving average (EMA), indicating a potential bearish trend.
Fibonacci Retracement Levels: The price is near the 0.618 Fibonacci retracement level, which could act as a resistance.
Support and Resistance: The chart identifies a potential "Buy Zone" between 160 and 166.80. If the price breaks below this zone, it might retest the 148 level.
RSI: The relative strength index (RSI) is currently above 50, suggesting that the stock is in an overbought condition. However, it's not at extreme levels, so there's potential for further upside.
Potential Outlook - Based on the technical analysis, here are some potential scenarios:
Bullish Scenario: If the price can break above the 0.618 Fibonacci level and sustain above the 200-day EMA, it could signal a bullish reversal.
Bearish Scenario: If the price breaks below the "Buy Zone" and retests the 148 level, it could indicate further downside pressure.
Recommendations - Given the current technical indicators, a cautious approach is recommended. While the "Buy Zone" might offer a potential entry point, it's essential to consider other factors such as fundamental analysis and risk tolerance.
Remember, technical analysis is just one tool in the investment toolbox. Always conduct thorough research and consider multiple perspectives before making investment decisions.
Disclaimer:- This analysis is based on the provided chart and is for informational purposes only. It does not constitute financial advice. Always consult with a financial advisor before making investment decisions. Do your own research before buying this stock because I am not SEBI registered person and this is just for educational purposes. We are not responsible for your loss.
Thanks for your support as always

Technical Analysis of Indian Oil Corp Ltd (IOC)Technical Analysis of Indian Oil Corp Ltd (IOC)
This is a technical analysis chart of Indian Oil Corp Ltd (IOC) on TradingView. The chart shows the price action of IOC over the past month, along with various technical indicators.
Here's a breakdown of the key elements in the chart:
Price Action:
Resistance levels: The chart shows several horizontal lines that represent resistance levels. These are areas where the price has struggled to move above in the past.
Support levels: The chart also shows several horizontal lines that represent support levels. These are areas where the price has struggled to move below in the past.
Consolidation zone: The chart highlights a consolidation zone between 150 and 170. This is a range where the price has been trading sideways for some time.
Pullback: The price recently pulled back from the resistance level at 173.37.
Technical Indicators Used for Analysis:
EMA (206, high): The chart shows a 206-day exponential moving average (EMA) of the high price. This indicator is used to identify trends and potential reversals.
Fibonacci retracements: The chart shows Fibonacci retracements levels at 0.236, 0.382, 0.5, 0.618, and 0.786. These levels are used to identify potential support and resistance areas based on past price movements.
Buy zone: The chart highlights a "buy zone" below the 0.236 Fibonacci retracement level. This is a potential area where traders may look to buy IOC shares.
Overall Analysis and my Personal Opinion:
Based on the technical analysis in the chart, IOC appears to be in a consolidation phase. The price is currently trading near the support level at 172.67. If the price breaks below this level, it could signal a further decline. However, if the price can break above the resistance level at 173.37, it could indicate a bullish reversal.
Disclaimer:- It's important to note that this is just a technical analysis of IOC, and other factors such as fundamental analysis should also be considered before making any investment decisions because I am not SEBI registered person to suggest any stock. This is my personal opinion for education purposes.

INDIAN OIL CORP LTD S/RSupport and Resistance Levels:
Support Levels: These are price points (green line/share) where a downward trend may be halted due to a concentration of buying interest. Imagine them as a safety net where buyers step in, preventing further decline.
Resistance Levels: Conversely, resistance levels (red line/shade) are where upward trends might stall due to increased selling interest. They act like a ceiling where sellers come in to push prices down.
Breakouts:
Bullish Breakout: When the price moves above resistance, it often indicates strong buying interest and the potential for a continued uptrend. Traders may view this as a signal to buy or hold.
Bearish Breakout: When the price falls below support, it can signal strong selling interest and the potential for a continued downtrend. Traders might see this as a cue to sell or avoid buying.
20 EMA (Exponential Moving Average):
Above 20 EMA: If the stock price is above the 20 EMA, it suggests a potential uptrend or bullish momentum.
Below 20 EMA: If the stock price is below the 20 EMA, it indicates a potential downtrend or bearish momentum.
Trendline: A trendline is a straight line drawn on a chart to represent the general direction of a data point set.
Uptrend Line: Drawn by connecting the lows in an upward trend. Indicates that the price is moving higher over time. Acts as a support level, where prices tend to bounce upward.
Downtrend Line: Drawn by connecting the highs in a downward trend. Indicates that the price is moving lower over time. It acts as a resistance level, where prices tend to drop.
RSI: RSI readings greater than the 70 level are overbought territory, and RSI readings lower than the 30 level are considered oversold territory.
Combining RSI with Support and Resistance:
Support Level: This is a price level where a stock tends to find buying interest, preventing it from falling further. If RSI is showing an oversold condition (below 30) and the price is near or at a strong support level, it could be a good buy signal.
Resistance Level: This is a price level where a stock tends to find selling interest, preventing it from rising further. If RSI is showing an overbought condition (above 70) and the price is near or at a strong resistance level, it could be a signal to sell or short the asset.
Disclaimer:
I am not a SEBI registered. The information provided here is for learning purposes only and should not be interpreted as financial advice. Consider the broader market context and consult with a qualified financial advisor before making investment decisions.

Indian Oil Corporation LimitedNext Big move on Indian Oil Corporation Limited
For Longs as price is at the Fib Golden zone, Rejected at order block with fair value gap, Wait for the trend line brake with volume. take a lower time frame long entry to increase risk to reward ratio..

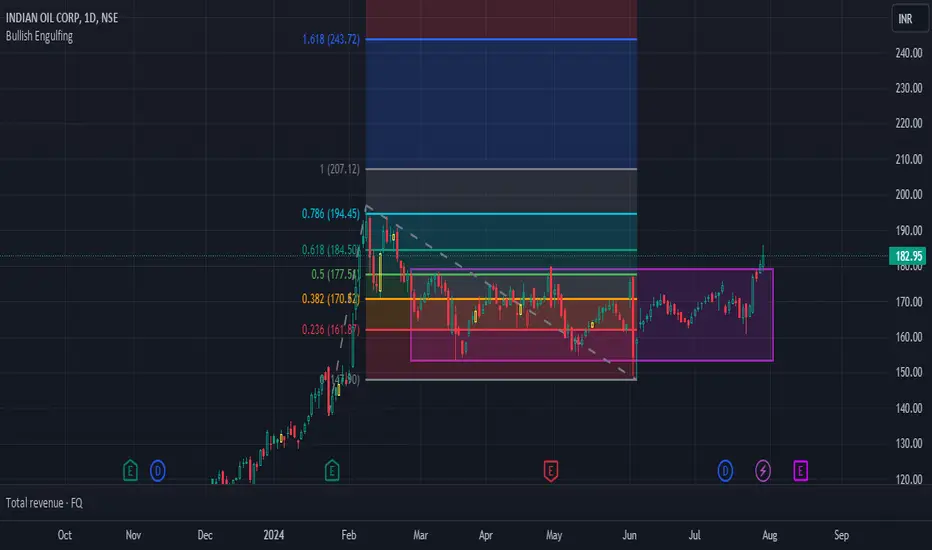
IOC BreakoutIOC NSE:IOC looking for a breakout after Consolidation. Buy above 184 and 1st target would be 207. The Next Target would be 240, however this can be achieved using GTT if you are ready to take Risk!
Indian Oil Corporation Ltd (IOC) - Breakout WatchAwaiting Breakout Opportunity: Monitoring for a potential breakout.
Good Volume Support: Healthy trading volume backing the move.

IOC, Bull PennantPotential breakout from the Pennant,
Target at 194, Stoploss at 159
Disclaimer : I am a aspiring swing trader, i have only started to learn to catch the pattern. So, please take this only as a idea
