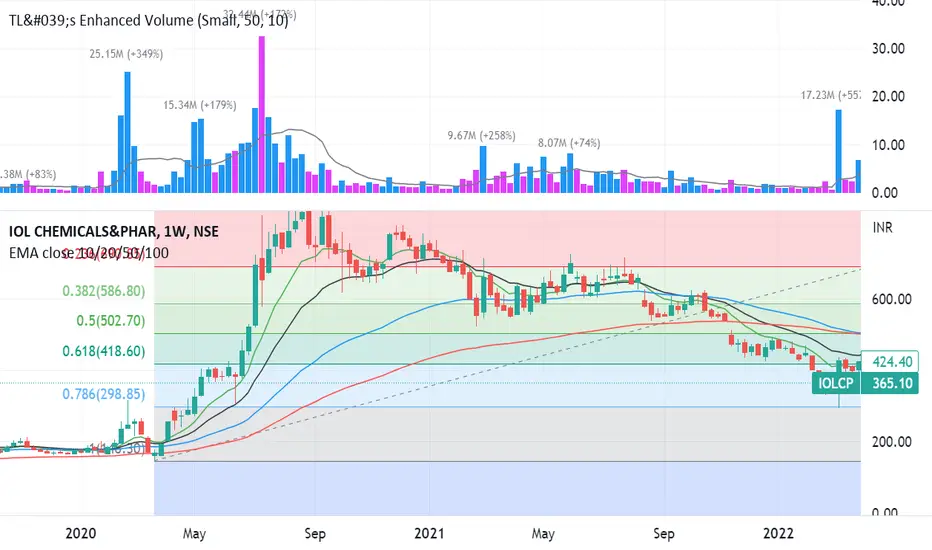
IOLCP long0.786 retracement (taken from last march 2020 rally to ATH).
Near 300 big volume delivery observed.
Talking about fundamentals, they are great !!!
As everyone says, pharma and construction are sectors for the next five years, then its my pharma top pick 2
IOLCP trade ideas
IOLCP look goodsIOL Chemicals Receives Patent for Improved Sartan Drugs Preparation Process; Shares Jump 7%
can expected to touch trend line @ 500
once cross then round bottom pattern form

Weekly Chart - IOL Chemicals PharmaThe Structure looks good to us, waiting for this instrument to correct and then give us these opportunities as shown on this instrument (Price Chart).
Note: Its my view only and its for educational purpose only. Only who has got knowledge about this strategy, will understand what to be done on this setup. its purely based on my technical analysis only (strategies). we don't focus on the short term moves, we look for only for Bullish or Bearish Impulsive moves on the setups after a good price action is formed as per the strategy. we never get into corrective moves. because it will test our patience and also it will be a bullish or a bearish trap. and try trade the big moves.
we do not get into bullish or bearish traps. We anticipate and get into only big bullish or bearish moves (Impulsive Moves). Just ride the Bullish or Bearish Impulsive Move. Learn & Know the Complete Market Cycle.
Buy Low and Sell High Concept. Buy at Cheaper Price and Sell at Expensive Price.
Keep it simple, keep it Unique.
please keep your comments useful & respectful.
Thanks for your support....
Tradelikemee Academy

IOLCP look goodsResistence @ 358
2nd Resistence @ 388
Once cross 520 level
Goverment appvoed Patent for Invention Entitled

IOLCP BUY @ 343.3entrt 343.3
qty 20
risk 206rs
sl 333
very tight SL
expecting good short term move. Overall its bearish with 200 price range as very big support


Price action HH & HLAs chart says price wont go in one direction upside.
Therefore price has came down to retrace and retest its Breakout level.
Bottom side can be bought or added.
Invest your time before investing your money.


IOLCP - A booming chemical stockRead chart well !!!
Company is almost debt free. Company has delivered good profit growth of 67.35% CAGR over last 5 years.
Company has a good return on equity (ROE) track record: 3 Years ROE 51.94%.
IOL Chemicals & Pharmaceuticals Ltd. engages in the manufacture of organic and inorganic chemical compounds.
It operates through the following geographical segments: India and Rest of the World.
The company was founded on September 28, 1986 and is headquartered in Ludhiana, India.
It is the largest player of Ibuprofen (pain killer) globally with a world market share of 35%.

IOLCP - Downtrend - Short term target 382 , may be 302 as well IOLCP had a massive run up and has been been on bearish trend after making all time high. This is a no touch stock right now, as the short term and mid term trend are bearish. It's making higher high and lower lows, one can start investing after the trend starts reversing to bullish. Volume has also died down, basically no interest from institutional investors. Don't try catching a falling knife. You can keep shorting the stocks until trend changes. I see target 382 coming and may be 302 as well.

IOL CHEMICALS - NEAR DEMAND ZONEIOL Chemicals seen strong holding the major support trend line.one can go long near to the support with stops below support zone.
this analysis is for educational purpose only.
we are not SEBI registered, kindly contact your financial advisor before taking trade.

IOLCPIOLCP - Uptrend
Above 50 Moving Average
RSI - @ 59.33 which is good
MACD - uptrend
1st Target - 620 Next target 630
Incase there is a fall There is good support at 596
Like & Follow :)

iolcp its in consolidation from a long time , it may give a good move upside after the trendline breakout .

IOL CHEMICALsStocks now break the trendline
Bullish trend start according to me
Target mentioned in chart

Bullish on IOL Chem(Daily)
- Change of Polarity ↕
- Symmetric triangle pattern breakout
- closed above 200 MA


IOL CP on verge of BOIOLCP, one of the favourites in Chemical sector, is awaiting volume confirmation,once it starts upward journey can give handsome return


Long IOL Chem&PharmaCurrent :
EPS - 78.8
2020 Profit - Rs.361 Crore
Current MP - Rs. 686
Forecast:
EPS - 80+
2021 Profit - Rs.425+ Crore
Intrinsic value share - Rs.1200+


Long on IOLCPFirst Day of breakout, wait for confirmation for 1 more trading day, if sustains the support and trendline above 686 then can enter for immediate target of 730-738.
Next Target – 779
Next Target – 800
RSI is comfortable
Volumes are good
Good Fundamentals
Medium term holding can be good for this quarter atleast

IOLCP/INR Bullish Breakout TA Update#IOLCP/INR ( India Stock )
₹IOLCP currently broke out resistance.
And I am expecting minimum 50% from here.
If I follow chart then Target will be 100% from here.
But 50% is safe side.
Entry:- below ₹680 is good entry.
Targets:- ₹788/₹895/₹1078/₹1310
Stop Loss:- ₹599
Please click like button and Appreciate my hard work.
Must follow me for latest crypto real time updates.
Thank you.
