Possibilities of IPCALABNSE:IPCALAB Stock currently break her resistance and also retracement complete, take position for first target of 1005 and stop loss is 925. Risk reward is 1:3
I am not SEBI registered, I am not responsible for any of your Profit/loss with this channel's suggestion. Please Consult your financial advisor before making any investment. I am providing trade views only for educational purpose
IPCALAB trade ideas

ipca lab strong buy completed its retracement and going very aggressively to break 950 levels very soon.

Bullish Flag pattern breakout in IPCALABIpca laboratories Ltd
Key highlights: 💡⚡
✅On 1Day Time Frame Stock Showing Breakout of Bullish Flag Pattern.
✅ Strong Bullish Candlestick Form on this timeframe.
✅It can give movement up to the Breakout target of 1145+.
✅Can Go Long in this stock by placing a stop loss below 845-.

long ipca lab cmp 740-750we can long ipca lab cmp 740-750
with stoploss of 670
1st target - 890
2nd target - 1366
2nd target expected till 31-dec-2023

IPCA LABSHello & Welcome to this analysis
The outlook has been down from quarterly, monthly, weekly & daily chart study.
Its been in a 2 years downtrend, now near a support but yet to give any reversal confirmation. If this level of 700 fails to hold the next major support comes in at 600.
Overall its a wait and watch stock even from a bounce back point of view

IPCALAB Shared @ 745 and now @ 900 !!NSE:IPCALAB shared Potential level @ 745 and with out SL stock flied to 900 now,
Trail or book profits....

IPCALAB Ascending Triangle !!NSE:IPCALAB
IPCALAB formed beautiful Ascending Triangle !!
All the levels marked !!

Panic Buying in IPCALABConditions Meeting:
1) Strong Stock
2) 50% Retracement from All time high.
3) Panic Buying after huge gap down opening.
4) Currently Pharma and Medical Sectors are booming.
Entry price range = 700 to 720
Stoploss Planning = Max Stoploss at 687
Profit Planning
1) Target 1 = Book 50% Qty at 1000 Price Level
2) Target 2 = Book 25% Qty at 1250 Price Level
3) Target 3 = Exit Completely when Sector starts reversing or the stock starts Reversing


IPCA Lab further correction IPCA Lab further correction ahead from 10 to 30 %
Broken trendline and ready for a correction

IPCALAB Low Risk Big Profit IdeaAs per my analysis, 707 level was strong resistance of NSE:IPCALAB . Now resistance has been brake and sustained above 707. My idea is to take buy entry at level of 707 with stop loss of 666 (-41 Points Risk). My expected upside target would be 766 (+59) & 966 (+259 Points).
It could be jackpot idea.
Note: This is my personal analysis, only to learn stock market behavior. Thanks.

#IPCALAB #Descendingtriangle #Breakout #CUPandHandle#IPCALAB formed beautiful cup&handle and longterm ascending triangle...
marked the levels on chart for learning
IPCA Laboratories Positional View Monthly Analysis @ 28 04 2023IPCA Laboratories Positional View @ 28 04 2023
IPCA Laboratories Positional View Monthly Analysis @ 28-04-2023
I Consider this is the Best Opportunity for Ipca Laboratories
I will be more Happy if i get another dips, Will Update this idea & decisions in coming months
Always Trade What You See not What You Feel........
"Be Fearful when others are Greedy and Greedy only when others are Fearful " - Warren Buffett
John Maynard Keynes said, “the markets can remain irrational longer than you can remain solvent.” So be cautious and flexible as market conditions evolve.
Than You Universe 🙏🙏🙏💐 Thanks to all my Teachers ....🙏🙏🙏💐

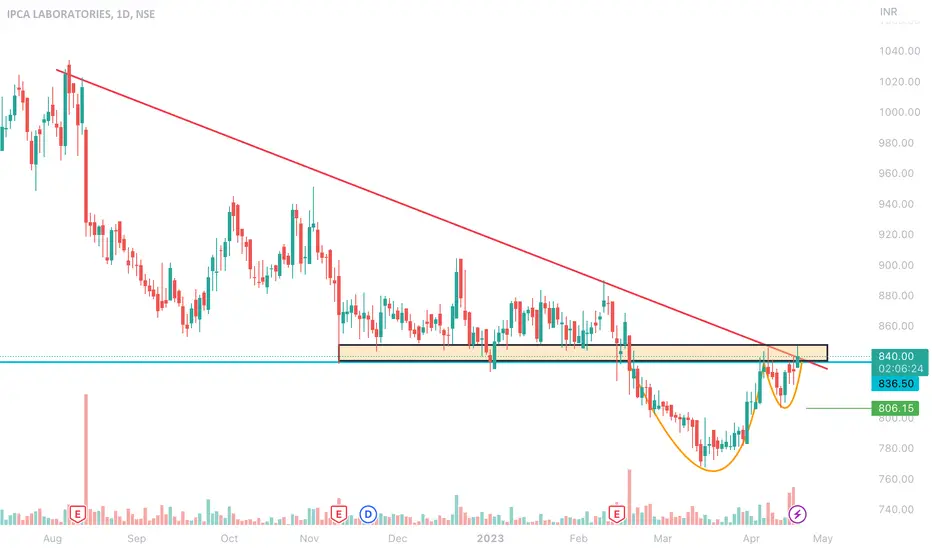
IPCALABIpcalab broke out of descending triangle pattern on daily charts with good volumes.
Could be bought with mentioned stoploss & target.

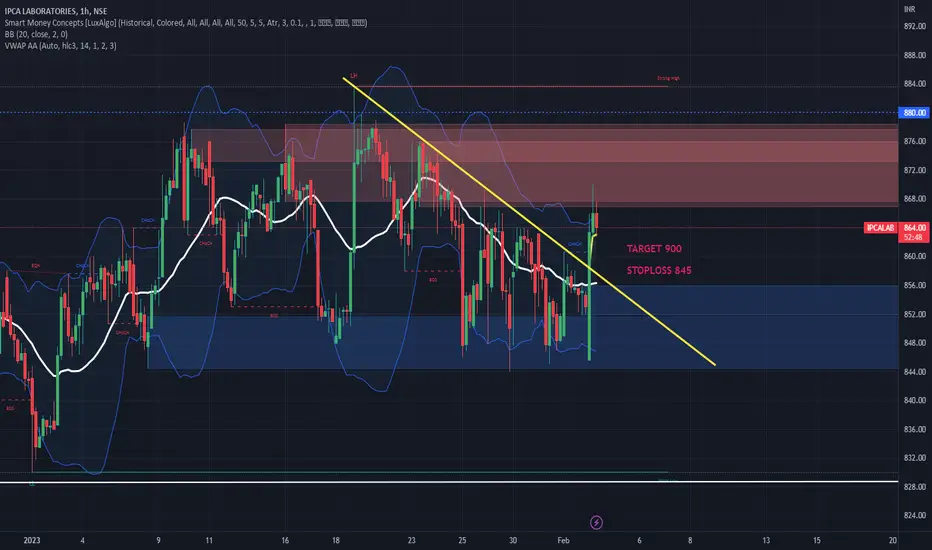
IPCALABIpcalab broke out of descending triangle pattern on hourly TF with decent volumes.
Could be bought with mnetioned stoploss & target.
Ipca lab Ipca lab good for a pattern breakout one can add at current levels
Ask your financial advisor before buying
Only for educational purposes
#IPCALAB #MOREPENLAB #DRREDDY #LAURUSLABS #DIVISLABS #AUROPHARMA#IPCALAB
NSE: IPCALAB
CMP: 864
TP: 980
SL: 840
TF: <6m
RR > ~4.5 times
Return > 13%
THYROCARE CNXPHARMA LUPIN SUNPHARMA SPARC DIVISLAB DRREDDY AUROPHARMA BALPHARMA GLENMARK SANOFI PFIZER BPLPHARMA MARKSANS BIOCON GRANULES IPCALAB LAURUSLABS NATCOPHARM GLAND ALKEM ZYDUSLIFE APOLLOHOSP FORTIS AARTIDRUGS ZYDUSWELL MAXHEALTH BAJAJHCARE
Factors:
BULLISH WEDGE BREAKOUT
Trend Following
Rising Volume with rising Prices.
Flag pattern breakout.
Pennant Pattern Breakout with Bullish Candle.
Retest Successful.
Higher Highs & Higher Lows.
Broken above RESISTANCE levels
Trading at SUPPORT levels
Earnings are strong.
Bullish Wedge Breakout
Risk Return Ratio is healthy.
And
Rising from Double Bottom Pattern to Flag Pattern forming.
If you like my work KINDLY LIKE SHARE & FOLLOW this page for free Stock Recommendations.
With 💚 from Rachit Sethia

IPCALABIPCA is placed @ strong congestion zone which it did clear in the morning but could nt sustain above 900-902 levels, sustaining above 900 with good volumes suggests it ll overcome will give a good breakout,
Could be bought here @ cmp 901-902 with menioned stoploss & targets.

IPca LAB can give 10-15% moveIpca lab base has made and now can move 10-15% upside
keep sl as 850 closing basis

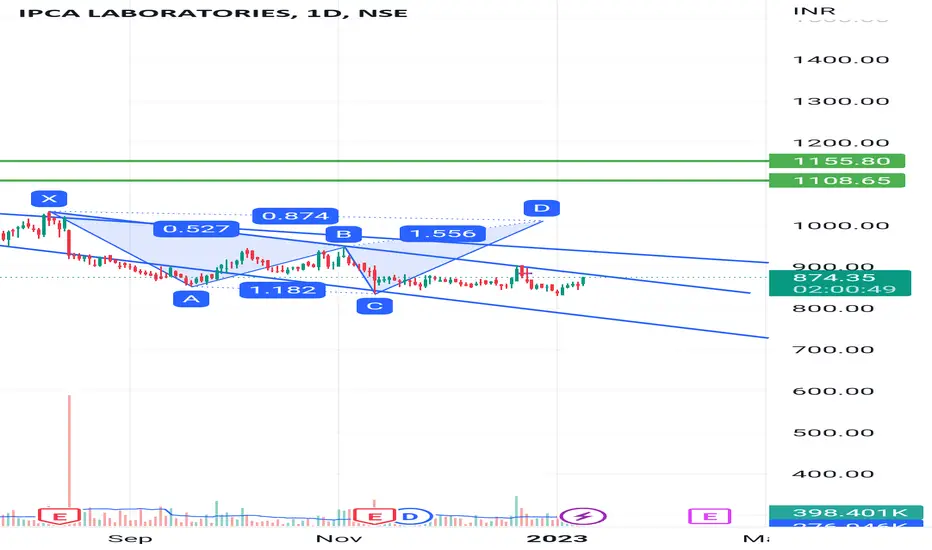
IPCA LABORATORIES : Potential Harmonic Reversal The idea here is about Ipca Laboratories:
Ipca Laboratories Ltd is a fully-integrated Indian pharmaceutical company manufacturing over 350 formulations and 80 APIs for various therapeutic segments.
1. Bullish Cypher pattern completed on a daily chart potential trend reversal expected. However, if the trend continues downward then the pattern is nullified. Out of Falling wedge trend at the moment.
2. What is Cypher Pattern? Explained in the below image:
3. Double top completed and currently looks like a Double bottom pattern under formation as per chart at the time of publishing.
4. Trading way below 20 & 200 EMA on Daily chart & between 20 & 200 EMA on a weekly chart.
5. Ichimoku Cloud analysis: Kumo Breakout & Kumo Twist on a daily, Weekly chart is Strong bearish & Strong Bullish on monthly chart.
6. RSI is at 30.37 on a Daily Chart at the time of publishing. This indicates almost oversold at the time of publishing.
7. MACD below signal line on daily chart, and converging towards signal line.
8. Hull Moving average on a daily & monthly is sell & on a weekly chart is a buy.
9. Wait for trend reversal & retest may be for long entry (short term). However, keep in watch list for the week & alert for price momentum.
Projected targets as per Cypher Pattern provided in the chart.
Stop Loss: Provided in chart as per Cypher pattern.
Disclaimer: “The above is an Educational idea only and not any kind of financial or investment advice. So please do your own DD (Due Diligence) before any kind of investment”.
Do you like my TA & ideas!!
Want to keep yourself updated with current market action? Then don’t forget boost & to subscribe for more analysis. Do leave your valuable feedback & comments for any improvisations.
Cheers.

Buy With Proper Stoploss
Pattern Never work lonely
here is a 20 - 50 average cross-over already done
third attempt of 200 sma
moreover cup handle pattern made already handle
in near days result will announce and as per my theory price Discount everything news, events and emotions.
So be careful and keep your stop loss tight

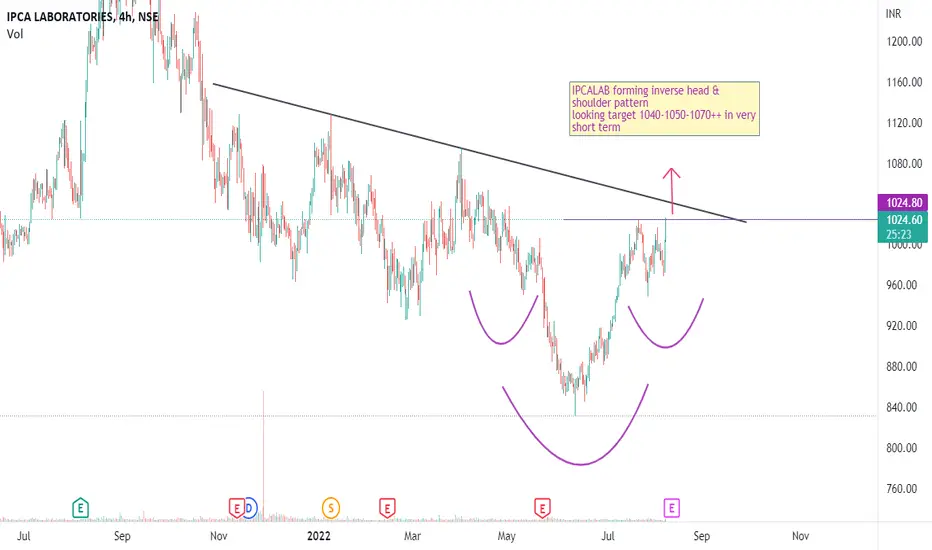
My view on IPCALABIPCALAB forming inverse head & shoulder pattern
looking target 1040-1050-1070++ in very short term
Keeping on radar IPCALAB 1020 CE
IPCA LABSNON LOG: Weekly TF, Price is at a strong support. THere may be some volatility at this level, which when broken will target 775
