IREDA - Break out stockHi, as per the technical it break the resistance and retracement under progress. as per the Day chart it could be Bull run, let see. This is my view and kindly consider only for educational purpose. Kindly update your comment to improve the accuracy!
IREDA trade ideas

IREDA Short_Price Rejection @ 20/ 50 Daily EMAIREDA Short:
- Price rejection @ 20/ 50 Daily EMA
- Enter Short when price favorable at lower timeframe
- Target 159
- SL - Today High or close above 20/ 50 Daily EMA

IREDA : Sell Triggered . Support 1 :160 , Support 2: 150
IREDA : Sell Triggered . Support 1 :160 , Support 2: 150
( Not a Buy / Sell Recommendation
Do your own due diligence ,Market is subject to risks, This is my own view and for learning only .)
Review and plan for 10th June 2025 Nifty future and banknifty future analysis and intraday plan.
Positional ideas.
This video is for information/education purpose only. you are 100% responsible for any actions you take by reading/viewing this post.
please consult your financial advisor before taking any action.
----Vinaykumar hiremath, CMT

IREDA_Long- Price breached a recent high (resistance) and moves up with good volume
- Breached 200 DEMA
- 20 DEMA > 50 DEMA
- Looks good for short term
Disc: Educational Purpose only

From Accumulation to Acceleration: IREDA Ready for a Run?Indian Renewable Energy Development Agency Ltd. is a non-banking financial company, which engages in the promotion, development, and extending financial assistance for energy conservation projects. It operates through the Financing Activities in the Renewable Energy and Energy Efficiency Sector and Generation of Power through Solar Plant Operations segments. The company was founded on March 11, 1987 and is headquartered in New Delhi, India.
IREDA remains well-positioned in the renewable-financing ecosystem, with strong fundamentals and proactive growth capital raising. Continued loan book expansion, robust profitability, and regulatory backing reinforce strategic upside, despite near-term dilution and credit vigilance.
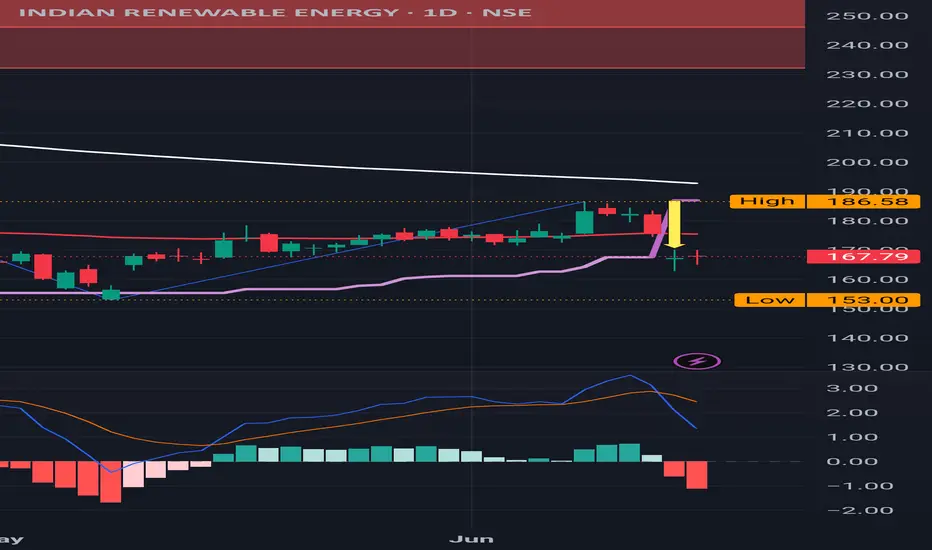
📊 Technical Analysis
🔸 Chart Pattern: Ascending Triangle
Base Support Zone: Around ₹145–₹150.
Higher Lows Formation: Indicates accumulation.
Resistance: ₹180–₹185 (currently testing).
Volume: Drying up during consolidation – a bullish sign per Minervini/Boik for potential breakout.
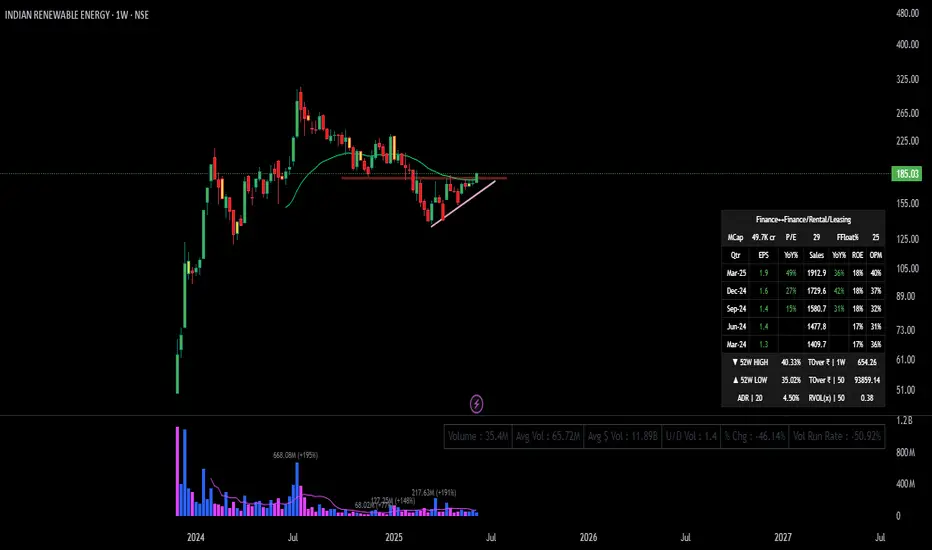
Moving Average: Price hovering near or reclaiming 30-week MA (Weinstein Stage 1 to Stage 2 transition).
📌 Stan Weinstein – Stage Analysis
Stage: Transition from Stage 1 (base) to potential Stage 2 breakout.
Needs strong volume breakout above ₹185–₹190 for confirmation.
📌 Anna Coulling – Volume Price Analysis (VPA)
Volume Decline on pullbacks confirms no aggressive selling.
Watch for volume spike + wide range candle above ₹185 to confirm buyer dominance.
📌 Mark Minervini – SEPA Criteria
Consolidation: 5-month tightening range.
Relative Strength: Bouncing back while broader markets corrected.
Trigger Entry: ₹180–₹186 (pivot point), with SL below ₹169.
📌 William O’Neil – CANSLIM Style
C: Current Earnings – Q4 EPS ₹1.9 (+49% YoY) ✅
A: Annual Earnings – consistent growth trend ✅
N: New – Transitioning sector, renewed momentum in green energy 🟡
S: Supply/Demand – Low float (25%), positive U/D volume ratio ✅
L: Leader – Improving performance, but not sector leader yet 🟡
I: Institutional Demand – Improving but needs volume surge ✅
M: Market – Tailwind from green energy and power reforms ✅
✅ Strengths:
High and rising Operating Margins (40%)
Growing Sales and EPS
Decent ROE (18%)
Small float stock – prone to sharp moves.
⚠️ Watchlist Risks:
Price still below previous highs – needs breakout confirmation.
Low volume participation recently.
🎯 Recommendation
📌 Action Plan:
NSE:IREDA Buy Above ₹180–₹185 with volume confirmation.
Target 1: ₹230
Target 2: ₹265
Stoploss: ₹169 (below triangle base)
📝 Summary
Indian Renewable Energy is on the verge of a technical breakout after a prolonged base. Supported by improving fundamentals, bullish volume structure, and classic accumulation patterns, it aligns well with the strategies of Weinstein, Minervini, and O'Neil. A breakout above ₹180–₹185 on volume will confirm a fresh rally phase.
IREDA forming Shark pattern now towards 200 and the further....IREDA has formed shark pattern it has immediate target for 200. with SL 190.
Consecutive 3 candles close above 200 will open targets as below,
Target2: 210 / 220
Also in short term it will have possible target for 250 / 270.

IREDAThis stock is showing signs of a potential reversal on the weekly timeframe, based on Fibonacci retracement levels, and may move upwards.

IREDA – VCP Breakout Loading? ⚡ IREDA – VCP Breakout Loading? 🔋
Sector: Renewable Finance | MCap ₹46,990 Cr
📊 Chart Analysis:
A clean Volatility Contraction Pattern (VCP) forming on the weekly chart —
📉 Each dip is shallower
📦 Volume contraction visible
📈 Tight price action near ₹175 resistance
🟢 Breakout Zone: ₹175
Strong fundamentals with rising EPS & sales
🚀 Watch for heavy volume breakout!
📈 Action Plan:
🛒 BUY above ₹175
🎯 Targets: ₹210 / ₹240
🔒 SL: ₹160
#IREDA #VCP #BreakoutStock #CANSLIM #TechnicalAnalysis #Investofino #StockMarketIndia #PowerPlay

IREDA Breakout Scenario (Upside):
If the price breaks above the upper line of the triangle, it will be considered a bullish signal.
Target Price: The upward movement could be equal to the height of the triangle, which may take the price to around ₹200–₹220.
Breakdown Scenario (Downside):
If the price breaks below the lower trendline, it will be considered a bearish signal.
Target Price: The downward movement could bring the price down to around ₹140–₹130.
If you find this helpful and want more FREE forecasts in TradingView, Hit the 'BOOST' button
Drop some feedback in the comments below! (e.g., What did you find most useful?
How can we improve?)
Your support is appreciated!
Now, it's your turn!
Be sure to leave a comment; let us know how you see this opportunity and forecast.
Have a successful week
DISCLAIMER: I am NOT a SEBI registered advisor or a financial adviser. All the views are for educational purpose only

IREDA SWING TRADE SETUP📊 Price Action & Trend Analysis
Analyzing market trends using price action, key support/resistance levels, and candlestick patterns to identify high-probability trade setups.
Always follow the trend and manage risk wisely!
Price Action Analysis Interprets Market Movements Using Patterns And Trends On Price Charts.
👉👉👉Follow us for Live Market Views/Trades/Analysis/News Updates.

Indian Renewable Energy view for Intraday 14th May #IREDA Indian Renewable Energy view for Intraday 14th May #IREDA
Resistance 170 Watching above 171 for upside movement...
Support area 165 Below 165 ignoring upside momentum for intraday
Watching below 164 for downside movement...
Above 170 ignoring downside move for intraday
Charts for Educational purposes only.
Please follow strict stop loss and risk reward if you follow the level.
Thanks,
V Trade Point

IREDA India should target 253.8Daily chart,
The stock NSE:IREDA has crossed a falling expanding wedge, and the target is 253.8, passing through a strong resistance level at 234.3
However, there is a strong Resistance line R, currently around 172.7
So, after stabilizing above 172.7 for 2 days, the target should be confirmed for a new entry (buy)
Consider a stop loss below 154, and raise the level along with the bullish movement.
Technical indicators:
RSI is forming a bullish direction - positive
MACD is about to cross up the zero line - To be assertive after crossing both the zero line and its signal.

IREDA India should target 253.8
Daily chart,
The stock NSE:IREDA has crossed a falling expanding wedge, and the target is 253.8, passing through a strong resistance level at 234.3
However, there is a strong Resistance line R, currently around 172.7
So, after stabilizing above 172.7 for 2 days, the target should be confirmed for a new entry (buy)
Consider a stop loss below 154, and raise the level along with the bullish movement.
Technical indicators:
RSI is forming a bullish direction - positive
MACD is about to cross up the zero line - To be assertive after crossing both the zero line and its signal.

Review and plan for 16th April 2025Nifty future and banknifty future analysis and intraday plan in kannada.
Result stocks.
This video is for information/education purpose only. you are 100% responsible for any actions you take by reading/viewing this post.
please consult your financial advisor before taking any action.
----Vinaykumar hiremath, CMT

IREDA (Indian Renewable Energy) - Elliott Wave AnalysisCurrent Market Structure:
The chart suggests that IREDA is undergoing a Wave (2) correction after completing a strong impulsive Wave (1).
The corrective phase is labeled as an A-B-C structure, indicating a possible end to the pullback in the coming weeks or months.
Wave Count & Key Levels:
Wave A initiated the downward correction, followed by Wave B retracement, and now Wave C is in progress, subdividing into a five-wave pattern.
The projected completion zone for Wave (2) is highlighted in the ₹50–₹80 range, aligning with Fibonacci extensions and previous structural support.
An additional 1.618 Fibonacci extension target is placed near ₹23.78, though this would be an extreme case.
Outlook & Strategy:
If the price reaches the projected support zone and shows a strong reversal, it could indicate the beginning of a Wave (3) uptrend.
A confirmed break above key resistance levels and trendlines would strengthen the bullish case.
However, if selling pressure continues, a deeper correction toward the extreme target cannot be ruled out.
🚨 Disclaimer: The content shared is for educational and informational purposes only and should not be considered financial advice, investment recommendations, or trading signals. I am not a SEBI-registered analyst or advisor. Always conduct your own research and analysis before making any financial decisions. Trading and investing involve significant risk, and past performance is not indicative of future results. I may be completely wrong in my analysis. Please consult a professional financial advisor before making any investment decisions.

BUY IREDAAfter downside consolidation, stock has show reversal sign and change trend tendency. trader can look forward to buy at current level 196-200rs with TARGET OF 127, 145 AND FOLLOW STOPLOSS OF 175.
Indian budget will present in next month and experts are looking for incremental Government spending which will ultimately beneficial for renewable finance company like IREDA.


A great time to re invest in IREDA.The stock has fallen almost 40% from its all time high and has taken out a lot of retail Stop losses and has given a change in its short term trend could end up into a long term trend.
Enter with decent quantity for a positional trade.
Disclaimer:
Investment should be done only when you are conviced on your idea instead of copying someone else, so do your own research before investing.

IREDA 2 BO OR NOT 2BO ?Ireda is pushing at the breakout level after long consolidation. A close above 241 will be valid breakout. RSI is rising and volumes are picking. The budget may offer more sops to the renewal sector. Valuations of private renewable energy companies is at a high .IREDA may join the party.

IREDA Early breakout opportunityIf we see a closing of above 240 in the weekly chart of IREDA then it can easily touch new heights without any issue.
This is a early stage breakout opportunity as the main factor for the breakout can be the results the company posts on Jan 9 .
#DYOR

IREDA :High Voltage DramaIREDA Analysis (20th Dec 2024)
The chart showcases a Bullish Flag Breakout , a golden retracement zone, and defined targets. Let’s analyze actionable insights and strategies.
Current Structure:
The stock has broken out from a bullish flag pattern, indicating a strong uptrend.
Retracement to the green zone (191-204) is likely before continuing its rally.
The first target zone is 243-248, with an extended target at 278.
A stop-loss at 186 is set below the golden retracement zone.
Action Plan:
Buying Opportunity: Enter between 191-204 (retracement zone). This level aligns with Fibonacci retracement and prior resistance turned support.
Targets: Partial profit booking near 243-248. Trail stop-loss to 220 for a move towards the extended target at 278.
Stop Loss: Place below 186 to limit downside risk.
Risk-Reward Ratio: Buying at 200 with targets at 243 and 278 offers a strong risk-reward of approximately 1:4.
Key Educational Note:
The breakout from a bullish flag pattern signifies continuation. Retracements are opportunities to enter the trend with limited risk.
Disclaimer: This analysis is for educational purposes only. Always verify with a certified financial advisor. Like and share to support!

IREDA WEEKLY TF AND DAY TF ANALYSES IREDA's stock has shown a significant upward move since its IPO, and despite many positive fundamentals, it's currently presenting a good buying opportunity from a technical perspective. In the weekly timeframe, the stock has reached a zone that previously acted as a supply area, and this is the first time it’s revisiting that level. In the daily timeframe, a parallel channel pattern breakout has already occurred. There is a strong expectation that the stock will soon reach its previous all-time high, making this a potentially profitable entry point.
