Value stock giving a breakoutDouble digit ROE and ROCE
Current price < Intrinsic value
PEG Ratio <1 (Ideal)
Current PE is < historical PE
EPS increasing QoQ
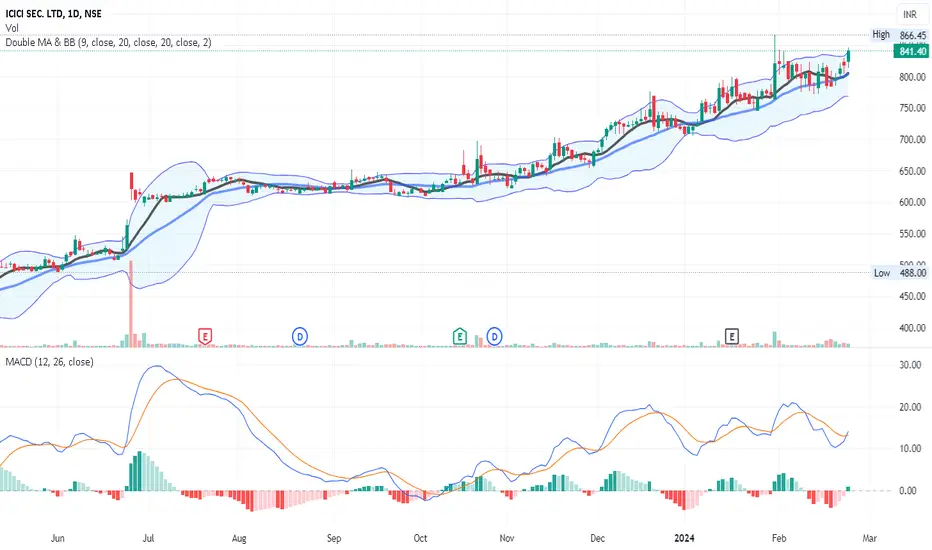
Technically, the price has formed a Cup and Handle pattern. Wait for the price to break the ATH of 920 with strong volumes. Can enter then OR on a retest.
Next report date
—
Report period
—
EPS estimate
—
Revenue estimate
—
60.15 INR
19.41 B INR
63.35 B INR
83.52 M
About ICICI SECURITIES LTD
Sector
Industry
CEO
T. K. Srirang
Website
Headquarters
Navi Mumbai
Founded
1995
ISIN
INE763G01038
FIGI
BBG00KB3J791
ICICI Securities Ltd. provides investment banking, institutional broking, retail broking, and wealth management services. It operates through the following segments: Treasury, Broking and Distribution, and Issuer Services and Advisory. The Treasury segment consists of income from treasury and investment income. The Broking and Distribution segment includes broking and other related activities, distribution of third-party products like mutual fund, life insurance, and sales credit for referred business and interest earned on funds used in brokerage business. The Issuer Services and Advisory segment offers financial advisory services, such as equity-debt issue management services, merger and acquisition advice, and other related activities. The company was founded on March 9, 1995 and is headquartered in Navi Mumbai, India.

ICICI Securities - Swing Long SetupThe 15-minute candle has already broken the entry zone of 838.75 , confirming the entry price at 839.70 . Here's my trade plan moving forward:
Entry Price: 839.70
Stop Loss: 821.90 (Valid only if a daily candle closes below this level)
Target: 872.45
Now that the entry is confirmed, I'm


READY FOR CUP & HANDLE BREAKOUT....NSE:ISEC trade at 808. Resistence @ 888. Support @ 708
On the weekly chart clearly made a Cup & Handle Pattern. After the breakout you can watch next Resistence @ 1200.

ICICI SECURITIES LTD S/RSupport and Resistance Levels:
Support Levels: These are price points (green line/share) where a downward trend may be halted due to a concentration of buying interest. Imagine them as a safety net where buyers step in, preventing further decline.
Resistance Levels: Conversely, resistance levels (re

ISEC - ICICI Securities - Uptrend - Long1. Head and Shoulder Pattern
2. BoS
3. ADX - started to show the trend strength

isec head and shoulder formationin this stock as per my study it gives us good head and shoulder pattern breckout. it increase good volume with breckout....

ICICI securities - Long ICICI securities is looking like it will continue its uptrent in next 3-6 months. Post it's recent correction and slight downfall now the stock is consolidating for breaching last rejection level at around Rs. 780.
Post breakout the stock may hit 1000+ keep an eye for same.

Breakout On D/W/M Chart - ISEC📊 Script: ISEC
📊 Sector: Stock/ Commodity Brokers
📊 Industry: Finance & Investments
Key highlights: 💡⚡
📈 Script is trading at upper band of BB and giving breakout of it.
📈 MACD is giving crossover .
📈 Double Moving Averages is giving crossover.
📈 Right now RSI is around 65.
📈 One can go for Swing
💥ICICI Securities💥-Nice Breakout💥ICICI Securities💥-Nice Breakout
Capital to be deployed- 20k
Investing Price-740-745
Breakout Price-733
Stoploss-615
Targets-1070-1292-1800
RT for max reach
#ICICIBank #stockstowatch #StocksToBuy #StocksInFocus #stocks #StockMarket

See all ideas
Summarizing what the indicators are suggesting.
Oscillators
Neutral
SellBuy
Strong sellStrong buy
Strong sellSellNeutralBuyStrong buy
Oscillators
Neutral
SellBuy
Strong sellStrong buy
Strong sellSellNeutralBuyStrong buy
Summary
Neutral
SellBuy
Strong sellStrong buy
Strong sellSellNeutralBuyStrong buy
Summary
Neutral
SellBuy
Strong sellStrong buy
Strong sellSellNeutralBuyStrong buy
Summary
Neutral
SellBuy
Strong sellStrong buy
Strong sellSellNeutralBuyStrong buy
Moving Averages
Neutral
SellBuy
Strong sellStrong buy
Strong sellSellNeutralBuyStrong buy
Moving Averages
Neutral
SellBuy
Strong sellStrong buy
Strong sellSellNeutralBuyStrong buy
Displays a symbol's price movements over previous years to identify recurring trends.
Related stocks
Frequently Asked Questions
The current price of ISEC is 896.20 INR — it has increased by 1.70% in the past 24 hours. Watch ICICI SECURITIES LTD stock price performance more closely on the chart.
Depending on the exchange, the stock ticker may vary. For instance, on NSE exchange ICICI SECURITIES LTD stocks are traded under the ticker ISEC.
ISEC reached its all-time high on Sep 19, 2024 with the price of 922.45 INR, and its all-time low was 188.00 INR and was reached on Feb 12, 2019. View more price dynamics on ISEC chart.
See other stocks reaching their highest and lowest prices.
See other stocks reaching their highest and lowest prices.
ISEC stock is 2.36% volatile and has beta coefficient of 0.71. Track ICICI SECURITIES LTD stock price on the chart and check out the list of the most volatile stocks — is ICICI SECURITIES LTD there?
Today ICICI SECURITIES LTD has the market capitalization of 291.32 B, it has increased by 3.24% over the last week.
Yes, you can track ICICI SECURITIES LTD financials in yearly and quarterly reports right on TradingView.
ICICI SECURITIES LTD is going to release the next earnings report on Jul 29, 2025. Keep track of upcoming events with our Earnings Calendar.
ISEC net income for the last quarter is 3.81 B INR, while the quarter before that showed 5.04 B INR of net income which accounts for −24.47% change. Track more ICICI SECURITIES LTD financial stats to get the full picture.
EBITDA measures a company's operating performance, its growth signifies an improvement in the efficiency of a company. ICICI SECURITIES LTD EBITDA is 27.68 B INR, and current EBITDA margin is 43.69%. See more stats in ICICI SECURITIES LTD financial statements.
Like other stocks, ISEC shares are traded on stock exchanges, e.g. Nasdaq, Nyse, Euronext, and the easiest way to buy them is through an online stock broker. To do this, you need to open an account and follow a broker's procedures, then start trading. You can trade ICICI SECURITIES LTD stock right from TradingView charts — choose your broker and connect to your account.
Investing in stocks requires a comprehensive research: you should carefully study all the available data, e.g. company's financials, related news, and its technical analysis. So ICICI SECURITIES LTD technincal analysis shows the buy rating today, and its 1 week rating is strong buy. Since market conditions are prone to changes, it's worth looking a bit further into the future — according to the 1 month rating ICICI SECURITIES LTD stock shows the strong buy signal. See more of ICICI SECURITIES LTD technicals for a more comprehensive analysis.
If you're still not sure, try looking for inspiration in our curated watchlists.
If you're still not sure, try looking for inspiration in our curated watchlists.