Value stock giving a breakoutDouble digit ROE and ROCE
Current price < Intrinsic value
PEG Ratio <1 (Ideal)
Current PE is < historical PE
EPS increasing QoQ
Technically, the price has formed a Cup and Handle pattern. Wait for the price to break the ATH of 920 with strong volumes. Can enter then OR on a retest.
ISEC trade ideas

ICICI Securities - Swing Long SetupThe 15-minute candle has already broken the entry zone of 838.75 , confirming the entry price at 839.70 . Here's my trade plan moving forward:
Entry Price: 839.70
Stop Loss: 821.90 (Valid only if a daily candle closes below this level)
Target: 872.45
Now that the entry is confirmed, I'm looking for momentum to carry the price towards the target of 872.45 . The stop loss will only trigger if we see a daily candle close below 821.90 . Until then, I’ll hold the position and monitor how it develops.
Disclaimer: This isn’t financial advice—just sharing my thoughts for educational purposes. Manage your risk carefully and trade safe!


READY FOR CUP & HANDLE BREAKOUT....NSE:ISEC trade at 808. Resistence @ 888. Support @ 708
On the weekly chart clearly made a Cup & Handle Pattern. After the breakout you can watch next Resistence @ 1200.

ICICI SECURITIES LTD S/RSupport and Resistance Levels:
Support Levels: These are price points (green line/share) where a downward trend may be halted due to a concentration of buying interest. Imagine them as a safety net where buyers step in, preventing further decline.
Resistance Levels: Conversely, resistance levels (red line/shade) are where upward trends might stall due to increased selling interest. They act like a ceiling where sellers come in to push prices down.
Breakouts:
Bullish Breakout: When the price moves above resistance, it often indicates strong buying interest and the potential for a continued uptrend. Traders may view this as a signal to buy or hold.
Bearish Breakout: When the price falls below support, it can signal strong selling interest and the potential for a continued downtrend. Traders might see this as a cue to sell or avoid buying.
20 EMA (Exponential Moving Average):
Above 20 EMA: If the stock price is above the 20 EMA, it suggests a potential uptrend or bullish momentum.
Below 20 EMA: If the stock price is below the 20 EMA, it indicates a potential downtrend or bearish momentum.
Trendline: A trendline is a straight line drawn on a chart to represent the general direction of a data point set.
Uptrend Line: Drawn by connecting the lows in an upward trend. Indicates that the price is moving higher over time. Acts as a support level, where prices tend to bounce upward.
Downtrend Line: Drawn by connecting the highs in a downward trend. Indicates that the price is moving lower over time. It acts as a resistance level, where prices tend to drop.
RSI: RSI readings greater than the 70 level are overbought territory, and RSI readings lower than the 30 level are considered oversold territory.
Combining RSI with Support and Resistance:
Support Level: This is a price level where a stock tends to find buying interest, preventing it from falling further. If RSI is showing an oversold condition (below 30) and the price is near or at a strong support level, it could be a good buy signal.
Resistance Level: This is a price level where a stock tends to find selling interest, preventing it from rising further. If RSI is showing an overbought condition (above 70) and the price is near or at a strong resistance level, it could be a signal to sell or short the asset.
Disclaimer:
I am not a SEBI registered. The information provided here is for learning purposes only and should not be interpreted as financial advice. Consider the broader market context and consult with a qualified financial advisor before making investment decisions.

ISEC - ICICI Securities - Uptrend - Long1. Head and Shoulder Pattern
2. BoS
3. ADX - started to show the trend strength

isec head and shoulder formationin this stock as per my study it gives us good head and shoulder pattern breckout. it increase good volume with breckout....

ICICI securities - Long ICICI securities is looking like it will continue its uptrent in next 3-6 months. Post it's recent correction and slight downfall now the stock is consolidating for breaching last rejection level at around Rs. 780.
Post breakout the stock may hit 1000+ keep an eye for same.

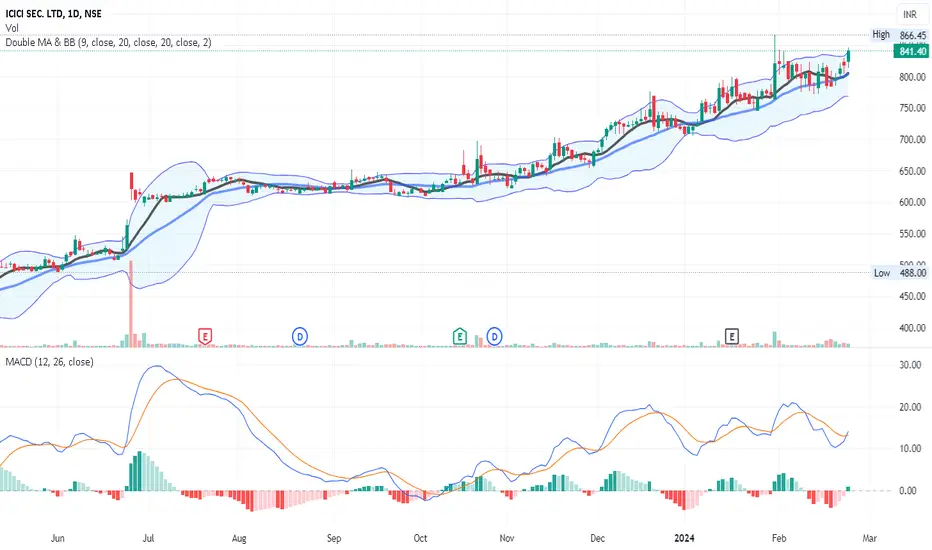
Breakout On D/W/M Chart - ISEC📊 Script: ISEC
📊 Sector: Stock/ Commodity Brokers
📊 Industry: Finance & Investments
Key highlights: 💡⚡
📈 Script is trading at upper band of BB and giving breakout of it.
📈 MACD is giving crossover .
📈 Double Moving Averages is giving crossover.
📈 Right now RSI is around 65.
📈 One can go for Swing Trade.
📈 Trendline Breakout on Daily chart.
📈 Rounding Bottom Breakout Soon on Weekly Chart.
📈 Rounding Bottom Breakout Soon on Monthly Chart.
⏱️ C.M.P 📑💰- 841
🟢 Target 🎯🏆 - 905
⚠️ Stoploss ☠️🚫 - 808
⚠️ Important: Always maintain your Risk & Reward Ratio.
✅Like and follow to never miss a new idea!✅
Disclaimer: I am not SEBI Registered Advisor. My posts are purely for training and educational purposes.
Eat🍜 Sleep😴 TradingView📈 Repeat 🔁
Happy learning with trading. Cheers!🥂
💥ICICI Securities💥-Nice Breakout💥ICICI Securities💥-Nice Breakout
Capital to be deployed- 20k
Investing Price-740-745
Breakout Price-733
Stoploss-615
Targets-1070-1292-1800
RT for max reach
#ICICIBank #stockstowatch #StocksToBuy #StocksInFocus #stocks #StockMarket


ICICI SECUIRITY LTD has looking good on weekly chartStock has given a range breakout on weekly chart
Company has a good return on equity (ROE) track record: 3 Years ROE 56.8%
Debt to Equity - 3.79

isecgreat pullback from low targets are high stoploss is preety short and targets are high , we can go with piramid buying system

ISECGood consolidation seen in Chart, More action can come above 652.
These are swing idea's which you can add your watchlist and analysis for yourself.
Keep on radar.
Potential upside stock!
This content for only education purpose!
I am not SEBI Register.

ISecAppearing strong after staying above the significant Gann levels at 606, we're now seeing a bullish trend on the hourly chart.
This suggests a potential uptrend in the upcoming sessions.
To manage risk, consider setting a stop loss just below 606, and you can spot your target prices and trailing stop loss levels using marked horizontal lines.

ISEC bull flagISEC is in bullish trend and now forming bull flag, waiting for breakout with volume to go long .


weekly chart of ICICI SECURITIESICICI SECURITIES on weekly chart seems to be forming Double bottom pattern or W pattern.
one can wait for neckline to break or resistance to break on weekly time frame with bullish candle.
Should be on watchlist for breakout and then can decide to take long

ISEC - Bullish ConsolidationNSE: ISEC is closing with a bullish consolidation candle supported with volumes.
Today's volumes and candlestick formation indicates strong demand and stock should move to previous swing highs in the coming days.
The stock has been moving along the horizontal support for the past few days which is indicating demand.
One can look for a 8% to 12% gain on deployed capital in this swing trade.
The view is to be discarded in the event of the stock breaking previous swing low.
#NSEindia #Trading #StockMarketindia #Tradingview #SwingTrade

ISECMaking hammer candlestick pattern in weekly time frame + double bottom and increasing foreign institutional investor (FII) holding so it is good for Trend reversal

ICICI SECURITIES This stock is looking weak
570 is strong resistance zone
trendline is strong support

ISEC has a target of 650stock is moving up to hit the confluence of channel median and central pivot point....target 650

