ITCNSE:ITC
Please note that we are not a SEBI Registered Investor Adviser/PMS/ Broking House.
All the contents over here are for educational purposes only and are not investment advice or recommendations
offered to any person(s) with respect to the purchase or sale of the stocks / futures and options.
You are also requested to apply your prudence and consult your advisers in case you choose to act on
any such content available as WE claims no responsibilities for any of your actions or any outcome of
such action
ITC trade ideas

ITC - SWING OPPURTUNITYITC has been trading in a descending channel, where it pulled back from the recent support and can be kept long for few days.we are not SEBI registered , This analysis is for educational purpose only, kindly contact your financial advisor before taking any positions.

Breakout and Retest in ITCBreakout and retest.
Target 1 = 310 (RR 1:6)
Target 2 = 380 (RR 1:10)
Stoploss @ 195
High probability swing trade opportunity.

ITC Long Term Bullish Trend - Slow upwards grind - BUY zone ITC has been a MEME stock for India stock traders as the performance of this stock has been very poor compared other stocks, even in the hyper bull run over last 18-20 months. But if you're a long investor and looking for defensive stocks with good dividend yields, wanting to preserve capital, ITC would be a good stock in the portfolio. If you notice the ITC chart closely, you can clearly see it has been in upwards bullish channel over last 18-20 months, making higher highs and lower lows. It's getting very close to test the lower channel support line and also 200 DMA support around 215-216 Rupees. If you're a mid term swing trader, you can buy low at the channel and sell when it hits channel upper line. Long term investors can start accumulating at 215-216 levels, as 2022 will be more defensive play and institutions will pile up their money in dividend paying stocks. Key Support line to watch 205 and 200. Key resistance line to watch 266-267.

Nifty 50 Stock Analysis Series - 7th stock - ITCNifty 50 Stock Analysis Series - 7th stock - ITC
--------------------------------------------------------
My Analysis:
----------------
** Daily Timeframe **
----------------------------
1. was in channel pattern till 15th Sep and got a breakout, surged to Rs.260 with little retest.
2. Then, the correction wave (ABC) started and is in the C wave. It may reach Rs.210 in the next 1-2 weeks.
3. MACD is also below. So, wait for now.
4. Target 1 - it may go up (10% at least) to Rs.240
5. Target 2 - it may go up (20% max) to Rs.260
6. Wait for entry. Entry and target points are marked in the chart.
Note:
I'm not recommending buying this stock. This is for education purposes.
This is my view, based on my learning.
Please do not trade without your own conviction.
Please invest after careful research. I'm not responsible for your profits/losses.
- Gnanasekaran

ITC Trend Analysis 20 Dec 2021ITC broke the support level in 4hr charts and also the Trendline support on weekly timeframe.
Is the bear trend begun for ITC and more downtrend expected?. What are your thoughts?
20 Dec 2021.

ITC making an ascending flag patternIn daily time frame ITC made an ascending flag pattern and given a breakout with good amount of volume, RSI shows overbought zone.. might it retest the level and move forward

ITC - Very Little HopeITC has formed a bearish flag pattern on weekly timeframe. It has recently tested the supply area and falling drastically ever since. This trend in confluence with any negative news such as omicron can bring the price to unexpected levels.

ITC Investors Meet @ Dec 14 2021ITC will hold its 'Institutional Investors and Financial Analysts Day' on Tuesday, 14th December, 2021 from 10.30 am
A news report by CNBC-TV18, citing sources, said that ITC is planning to finalise ‘next strategy’. The company may also look at integration across mega FMCG brands, the report added.
The stock market participants have also been expecting of the announcements or clarity related to the conglomerate's demerger of businesses.
ITC has a diversified presence across industries such as FMCG, hotels, packaging, paperboards, specialty papers and agribusiness. Shares of ITC have been somewhat of a dull performer amid the recent bull market rally. The scrip has remained in a rangebound trend and is up around just 6% this year as compared to a nearly 23% rise in benchmark Sensex.

Trendline Breakout - ITCLooks like ITC is heading towards a Bull run again after the announcement of "institutional and financial analysis day" on Tuesday.

ITCITC has given a good breakout of a trendline. Once it breaks the yellow line and takes a retest we can enter for swing trade.

ITC at the suppot zone on weekly time frameitc is on weekly time frame demand zone
also on weeklytime frame trendline
RSI is not breaking 50 range support
and same level taken multiple support on both trendilne RSI
seems it will take support from here
ITS good time to enter for long term long at the breakout or high volume daily candle at support zone 2015-217 level

ITC 4hr chart Head & shoulders pattern 02 Dec 2021ITC 4hr chart formed a Head & shoulders pattern. Watch out for Breakdown. 02 Dec 2021

ITC LTDITC , it's not looks good in monthly,
1. Head and shoulders
2. Inverted cup and handle
But lets see , any news may affect

Head and Shoulder on ITCITC stock is showing volatility and moving with the current downtrend of market. The chart pattern on ITC shows a head and shoulder pattern. With that pattern, the script broke support at 230 and moved below. With current analysis, the script could form new resistance at 217. If the script trades below 217, it could be considered as a result of negative news overshawdowing the positive financial results. However, in this scenario it is unlikely to see that happening. The next strategy for investor should be to wait till ITC script hits 217 region and then go long in the script. After that, the finbonacci revrsal indicates the script could hit 230 price range. Happy Investing!

Tata motors Sell below 237.4Sell - 237.4
TG - 234.3
SL - 240
Pls trade with strict Stoploss and Target


ITC Rallied - What's next ??ITC tumbled down from 262 levels to 222 levels.
It created support around 222 levels, tested it many times, and started rallying again.
Structure on the shorter timeframe is of higher highs and higher lows.
Today it rallied to around 245 levels, but couldn't sustain and closed around 239 levels.
Immediate support for the stock is around 237-238 levels, if it sustains these support levels, it will try to retest its previous highs again.

ITC wave analysisITC completed wave 1 leading daigonal which started in 2020.wave 2 correction is going on.powerful wave 3 is likely to start either from 174 level or from 220 level towards 538.


My Stone Line, Follow Always, Win AlwaysITC pattern speaks a lot. Go for a long. SL 227.5 #gosimple #Nomoretools #aajsimplekartehey #bullabhibakihey


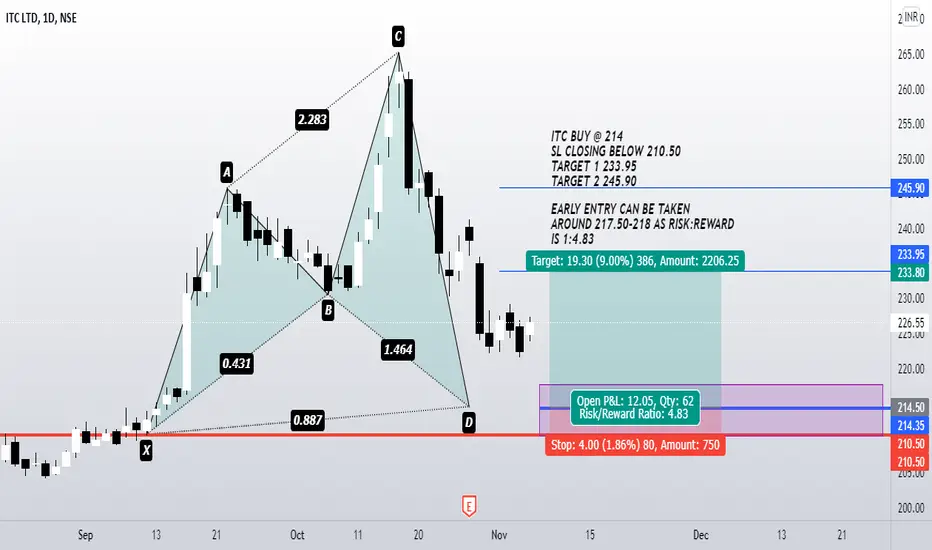
ITC ON RADAR !Itc should reverse from the given level a trade can be taken from given level as risk: reward is very favorable !