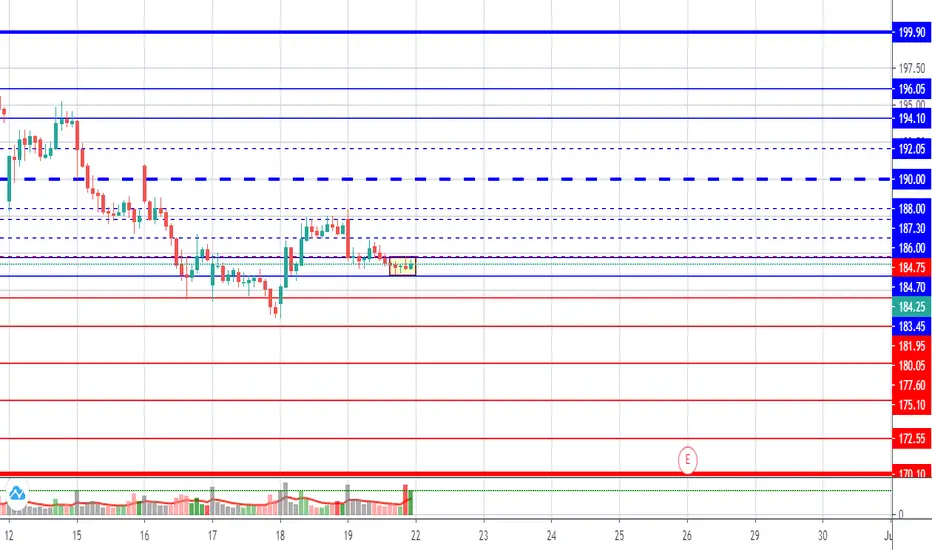
ITC 22nd june 2020my TGT
ITC buy above184.80 TGT=186/187.30/188/190/192/194...200
sell below 183.45 TGT=182/180.10/177/175/172
ITC trade ideas


ITC_Rising wedgeITC shown a good revival post KKR takeover (after a sideways movement since 2017 and further worsening during covid ) , the current patters are showing is a rising wedge pattern and may fall into downward trend after couple of weeks

Go Long on ITC with stop loss of 194 target 234- 240 based PAITC moved above 194 weekly resistance now act as a stop loss with Target 234 -240.


ITC BULLISH CAN GO FOR LONGITC has give bullish engulf and one can go for long. The entry idea and the stop loss and everyday intraday trading ideas are given on our tellegrammm channnel UG MARKET. Do your own research before taking a trade.


itc 15th june 2020Please do ur own analysis before trade.
This is only for education purpose
itc my tgt
buy above=195 tgt up to 204
sell below 193.35 tgt -185

Clear Down is Vissible upto 179A) 1, 3, 4, Reacts as a sign of Good up movement/ uptrend
( reverse of Rs.179.00 will be a good take off for the
breakout of Rs. 199.00 and the target will be around 220 for shorterm)
B)No. 2, 3a reacts as a continuous downtrend
(if the above fails the price will react at Rs.170 then it will expected
to go down or otherwise it will confirm the next clear trend at around Rs.190.00)
* NOTE- THIS IS MY PERSONAL ANALYSIS AND IT WAS POSTED FOR KNOWLEDGE SHARING BASIS
Clearly this is NOT FOR ANY KIND OF SUGGESTION TO BUY OR SELL.


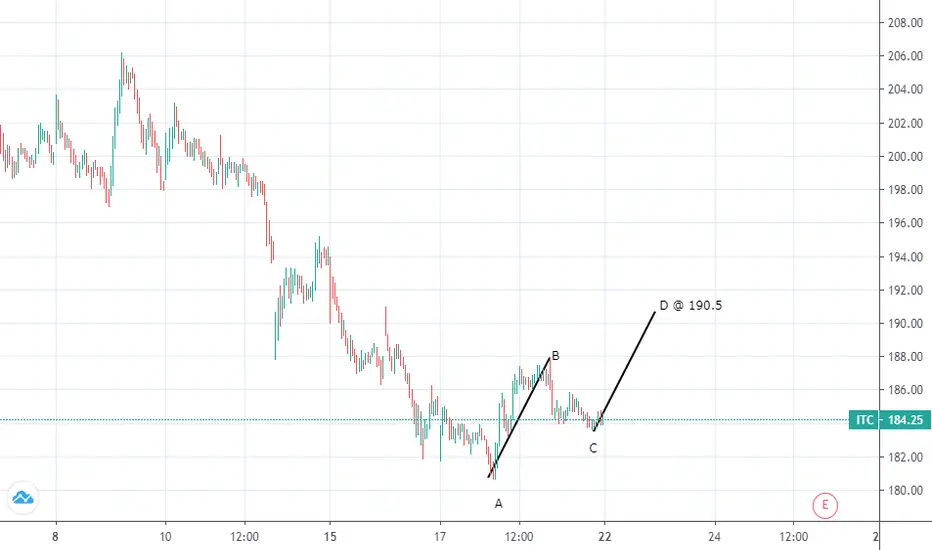
ITC PULLBACKITC formed a bearish crab and expected to pullback few points down
Target 190
Stoploss 204

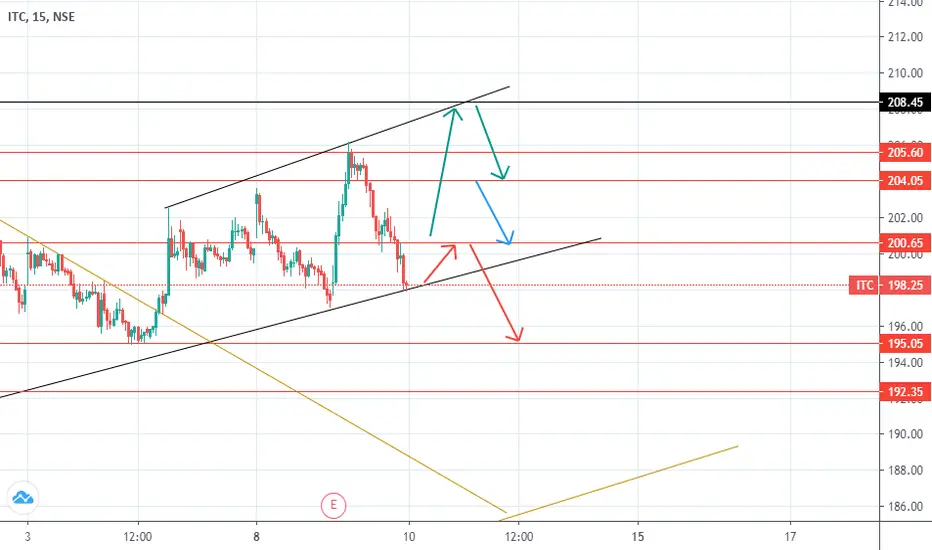
ITC intraday projectionPossible start and reversal levels are shown in different colors with support and resistance levels shown
ITC Grinding on upA little dip to 188 would be nice, 236-241 next after we flip 206 .
7 day offering support if only a wafer thin support .
99 day at 188.10 is the lower support , should be an awesome entry . Am looking at buying the breakout for a quick scalp .

ITC (Continuation of Trend or Breakdown)After a constant uptrend ITC has been defying the market trend for the last 4-5 days and has been consolidating while the market has been making new highs.
A triangle formation can be seen, however if the price breaks away to the upside, we can expect the high of 1st of June to act as a crucial resistance area and a breach of the same can take the price to 217 levels. However there are a lot of support zones on the downside. Levels of 194 will have to be watched closely post which the zone of 187-185 looks strong.
A lot will also depend on how the markets opens up, with SGX nifty gearing the nifty up for a strong start watchout for the breakaway levels and then take a trade.


ITC from 6 June 2020ITC is in consolidation zone . .. with high uptrend possibility higher lows forming
for risk takers buy above 203 ...
...
buy only when rsi above 60 in hourly chart with small target if 210 ..
safe traders buy only when red line becomes support for new trend cycle


ITC rally may halt near 220 levelsNSE:ITC which is in a downtrend in monthly timeframe is currently retracing its excess fall.
But this rally may pause near 220 levels.

ITC - in between support and resistance Resistance @ 200 - Price + Fib + Trend line
Support @ 190 - Previous swing resistance turned support.
Probability - Might go sideways in the range , therefore i am waiting for a breakout/breakdown before initiating any trade.
