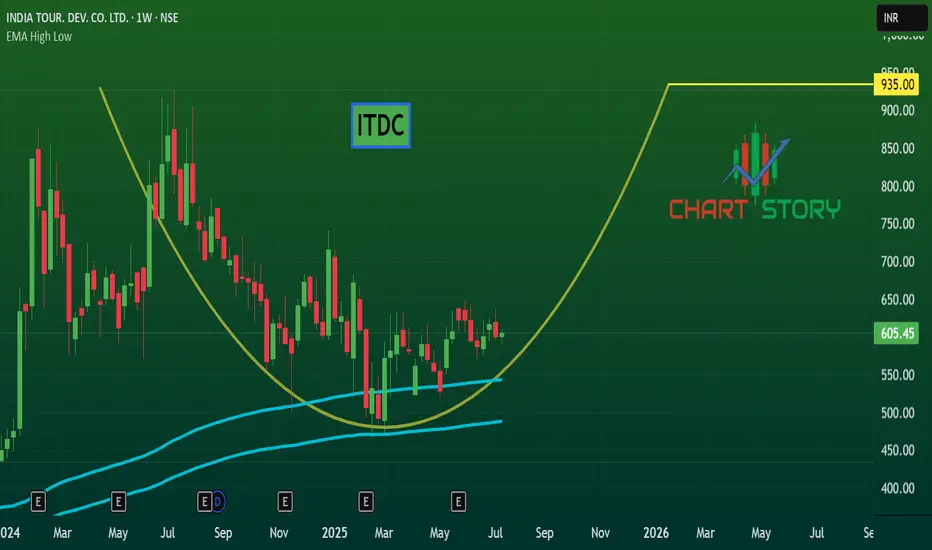
ITDC - LongITDC rounding bottom base completed aND ready to move up.
Volume has contracted as well. Very less daily volume.
Strong promoter holding.. govt holding
New ITDC director has come, so she will bring changes.
9.45 INR
815.45 M INR
5.70 B INR
4.38 M
About INDIA TOUR. DEV. CO. LTD.
Sector
Industry
CEO
Mugdha Sinha
Website
Headquarters
New Delhi
Founded
1966
ISIN
INE353K01014
FIGI
BBG000BM9NK6
India Tourism Development Corp. Ltd. engages in the provision of hotels, restaurants and transport facilities. It operates through the following segments: Hotel and Restaurants Operations; Duty Free Shops Operations; Travel and Tour Operations; Ashok Events and Miscellaneous Operations; Construction, Consultancy, and Sound and Light Show Projects; and Others. The company was founded in October 1966 and is headquartered in New Delhi, India.
Related stocks

ITDC : 20% CLUB (BULLISH SIDE)ITDC
BULLISH ON M/D/W Time frames
Previous Swing High is taken out on a Daily TF
All good to go up (SL - 3-5%) for at least 20-25%
TGTs are depicted on the Chart

ITDC chart analysisITDC chart analysis on weekly time frame. As per my understanding it has given a breakout and a retest has also been done. Please give your valuable feedback.

Take a look at ITDCITDC looks good bet for positional trade
buy above 880 forthe target of 1045, 1345
SL around 760
This is not buys/sell recomendation
Strictly for educational purpose


[Positional] ITDC Buy IdeaNote -
One of the best forms of Price Action is to not try to predict at all. Instead of that, ACT on the price. So, this chart tells at "where" to act in "what direction. Unless it triggers, like, let's say the candle doesn't break the level which says "Buy if it breaks", You should not buy at all.

ITDCThis stock breakout nearly 5 years consolidation level so create good opportunity for swing trade and only for educational purpose

Buy Tourism Stocks - Enjoy your Vacation with ITDCEveryone wants to have a Break from their Routine Life - A Time with Family - A Pleasant Vacation, but all of these comes with Cost
Tourism Sector is a Very expensive area - Not just booking Hotels, Flight Tickets, Money is needed to Buy Gifts from Vacation spots, Food, Appropriate Clothing etc....

An educational study of potential trending pickNSE:ITDC :Indian tourism department corporation
A potential momentum pattern seen to be unfolding in the ITDC!
How would the price unfold, time could prove that right or wrong!
this is not a trade recommendation but a study of momentum!
This is exculsively for educational purpose.
Do consult

See all ideas
Summarizing what the indicators are suggesting.
Oscillators
Neutral
SellBuy
Strong sellStrong buy
Strong sellSellNeutralBuyStrong buy
Oscillators
Neutral
SellBuy
Strong sellStrong buy
Strong sellSellNeutralBuyStrong buy
Summary
Neutral
SellBuy
Strong sellStrong buy
Strong sellSellNeutralBuyStrong buy
Summary
Neutral
SellBuy
Strong sellStrong buy
Strong sellSellNeutralBuyStrong buy
Summary
Neutral
SellBuy
Strong sellStrong buy
Strong sellSellNeutralBuyStrong buy
Moving Averages
Neutral
SellBuy
Strong sellStrong buy
Strong sellSellNeutralBuyStrong buy
Moving Averages
Neutral
SellBuy
Strong sellStrong buy
Strong sellSellNeutralBuyStrong buy
Displays a symbol's price movements over previous years to identify recurring trends.
Frequently Asked Questions
The current price of ITDC is 576.60 INR — it has increased by 0.66% in the past 24 hours. Watch INDIA TOUR. DEV. CO. LTD. stock price performance more closely on the chart.
Depending on the exchange, the stock ticker may vary. For instance, on NSE exchange INDIA TOUR. DEV. CO. LTD. stocks are traded under the ticker ITDC.
ITDC stock has fallen by −1.87% compared to the previous week, the month change is a −4.20% fall, over the last year INDIA TOUR. DEV. CO. LTD. has showed a −26.27% decrease.
ITDC reached its all-time high on Jul 8, 2024 with the price of 930.80 INR, and its all-time low was 104.70 INR and was reached on Mar 24, 2020. View more price dynamics on ITDC chart.
See other stocks reaching their highest and lowest prices.
See other stocks reaching their highest and lowest prices.
ITDC stock is 1.65% volatile and has beta coefficient of 1.64. Track INDIA TOUR. DEV. CO. LTD. stock price on the chart and check out the list of the most volatile stocks — is INDIA TOUR. DEV. CO. LTD. there?
Today INDIA TOUR. DEV. CO. LTD. has the market capitalization of 49.11 B, it has decreased by −1.40% over the last week.
Yes, you can track INDIA TOUR. DEV. CO. LTD. financials in yearly and quarterly reports right on TradingView.
ITDC net income for the last quarter is 251.13 M INR, while the quarter before that showed 207.69 M INR of net income which accounts for 20.91% change. Track more INDIA TOUR. DEV. CO. LTD. financial stats to get the full picture.
Yes, ITDC dividends are paid annually. The last dividend per share was 2.52 INR. As of today, Dividend Yield (TTM)% is 0.44%. Tracking INDIA TOUR. DEV. CO. LTD. dividends might help you take more informed decisions.
EBITDA measures a company's operating performance, its growth signifies an improvement in the efficiency of a company. INDIA TOUR. DEV. CO. LTD. EBITDA is 854.25 M INR, and current EBITDA margin is 14.98%. See more stats in INDIA TOUR. DEV. CO. LTD. financial statements.
Like other stocks, ITDC shares are traded on stock exchanges, e.g. Nasdaq, Nyse, Euronext, and the easiest way to buy them is through an online stock broker. To do this, you need to open an account and follow a broker's procedures, then start trading. You can trade INDIA TOUR. DEV. CO. LTD. stock right from TradingView charts — choose your broker and connect to your account.
Investing in stocks requires a comprehensive research: you should carefully study all the available data, e.g. company's financials, related news, and its technical analysis. So INDIA TOUR. DEV. CO. LTD. technincal analysis shows the sell today, and its 1 week rating is sell. Since market conditions are prone to changes, it's worth looking a bit further into the future — according to the 1 month rating INDIA TOUR. DEV. CO. LTD. stock shows the neutral signal. See more of INDIA TOUR. DEV. CO. LTD. technicals for a more comprehensive analysis.
If you're still not sure, try looking for inspiration in our curated watchlists.
If you're still not sure, try looking for inspiration in our curated watchlists.