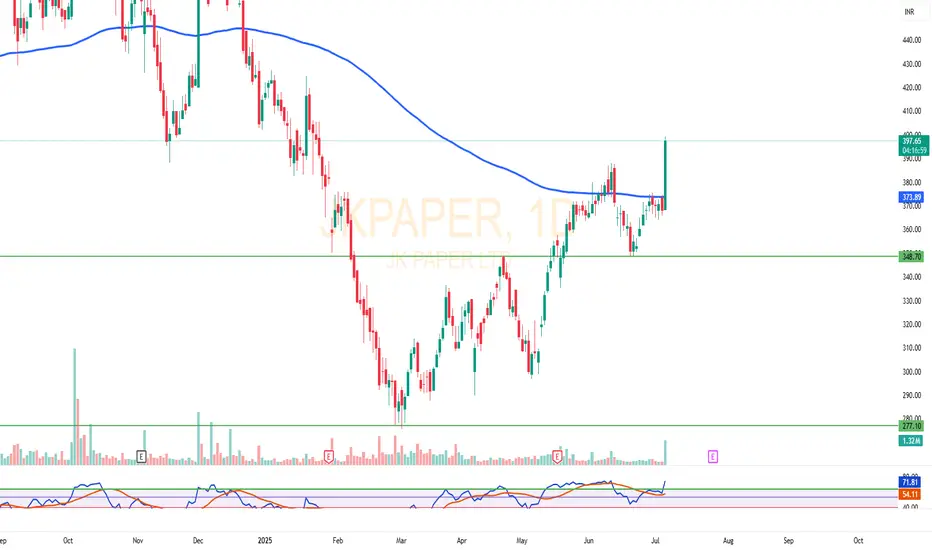
JK Paper Breakout Above 200-DMA | Bullish Momentum with Volume📌 **Stock:** JK Paper Ltd
🕒 **Timeframe:** Daily Chart
📈 **Pattern:** Price breakout above 200-DMA with volume confirmation
JK Paper has shown a strong bullish breakout above the 200-DMA for the first time in months. The breakout candle is supported by a sharp rise in volume. RSI is also trending above 60, indicating strong bullish momentum.
📍 **Entry Zone:** Above ₹396
🔻 **Support Levels:** ₹360 / ₹320
🎯 **Trade Plan:**
If the stock sustains above ₹396, we can expect further upside. Traders may look for a retest near the breakout level before fresh entry. Risk management is crucial.
⚠️ **Disclaimer:**
I am not a SEBI registered advisor. This analysis is shared only for educational and informational purposes. Please do your own research or consult a certified professional before making investment decisions.
JKPAPER trade ideas
JKPAPERJKPAPER, watch below levels on chart.
DISCLAIMER : I am NOT a SEBI registered advisor or a financial adviser. All the views are for educational purpose only.


Double bottom breakout and retest doneJk paper confirmed double bottom breakout and retest done on monthly chart. Stock ready for next upside 768 in 5-6 months.
Trading above 20/50/100/200 EMA on Daily weekly monthly chart.
Strong support at 450
This is just my view. Not any recommandation.

JK Paper Positional Trade Setup "📈 JK Paper Positional Trade Setup 🚀
Entry at ₹490 with a bullish outlook!
🎯 First Target: ₹565 (+15%)
🎯 Second Target: ₹612 (+25%)
💥 Mega Breakout: ₹633 (+33%)
🔻 Stop Loss: ₹473 (-7%)
🔍 Risk/Reward Ratio: 4.48
With RSI at 62.6 and strong volume support, this setup has multiple profit levels, aiming for a breakout!"
This structure gives clarity to your different exit points while emphasizing the mega breakout potential.

JK PAPER can turn paper in to currencyWeekly candle made clear confirmation for JK PAPER to invest in to it for turning your papers in to 💵, can give double top target in very near future.

Analyzing JK PAPER LTD: A Technical Perspective
In this analysis, we delve into the recent price movements of JK PAPER LTD, utilizing a combination of trendlines and the MACD&OBV indicator to uncover potential trading opportunities.
Weekly Trendline Analysis
The yellow trendline on the weekly chart highlights a long-term upward trend that has been in place since December 2021. This trendline has acted as a strong support level, with prices consistently bouncing off it. The sustained upward momentum suggests a bullish sentiment among long-term investors.
Daily Trendline Insights
On the daily chart, the orange trendline provides a closer look at the short-term price movements. This trendline has been tested multiple times, indicating its significance in the current trading environment. The convergence of the daily and weekly trendlines around the 600-640 price range suggests a critical support zone that traders should watch closely.
MACD&OBV Combination
The MACD&OBV indicator, with OBV as the source applied to MACD, offers additional insights into the stock’s momentum. The OBV tracks the volume flow, while the MACD helps identify changes in the strength, direction, momentum, and duration of the trend. The recent crossover above the zero line in the MACD&OBV indicator signals a potential bullish reversal, supported by increasing volume.
Key Takeaways
Support Levels: The yellow weekly trendline and the orange daily trendline converge around the 600-640 price range, forming a strong support zone.
Bullish Signals: The MACD&OBV indicator’s recent crossover above the zero line indicates a potential bullish reversal, backed by strong volume.
Trading Strategy: Traders might consider entering long positions near the support zone, with a stop-loss slightly below the weekly trendline. Monitoring the MACD&OBV indicator for further confirmation can enhance the trading strategy.
Conclusion
JK PAPER LTD presents an interesting case for technical analysts and traders. The combination of long-term and short-term trendlines, along with the MACD&OBV indicator, provides a comprehensive view of the stock’s potential movements. As always, traders should conduct their own research and consider market conditions before making any trading decisions.

JK Paper Set for Bullish Breakout!
Bullish breakout near ₹477.50
Resistance levels: ₹501.70, ₹531.85, ₹600.05, ₹638.45
RSI at 57.50, indicating strengthening momentum


JK PAPER LTD S/RSupport and Resistance Levels:
Support Levels: These are price points (green line/shade) where a downward trend may be halted due to a concentration of buying interest. Imagine them as a safety net where buyers step in, preventing further decline.
Resistance Levels: Conversely, resistance levels (red line/shade) are where upward trends might stall due to increased selling interest. They act like a ceiling where sellers come in to push prices down.
Breakouts:
Bullish Breakout: When the price moves above resistance, it often indicates strong buying interest and the potential for a continued uptrend. Traders may view this as a signal to buy or hold.
Bearish Breakout: When the price falls below support, it can signal strong selling interest and the potential for a continued downtrend. Traders might see this as a cue to sell or avoid buying.
20 EMA (Exponential Moving Average):
Above 20 EMA: If the stock price is above the 20 EMA, it suggests a potential uptrend or bullish momentum.
Below 20 EMA: If the stock price is below the 20 EMA, it indicates a potential downtrend or bearish momentum.
Trendline: A trendline is a straight line drawn on a chart to represent the general direction of a data point set.
Uptrend Line: Drawn by connecting the lows in an upward trend. Indicates that the price is moving higher over time. Acts as a support level, where prices tend to bounce upward.
Downtrend Line: Drawn by connecting the highs in a downward trend. Indicates that the price is moving lower over time. It acts as a resistance level, where prices tend to drop.
RSI: RSI readings greater than the 70 level are overbought territory, and RSI readings lower than the 30 level are considered oversold territory.
Combining RSI with Support and Resistance:
Support Level: This is a price level where a stock tends to find buying interest, preventing it from falling further. If RSI is showing an oversold condition (below 30) and the price is near or at a strong support level, it could be a good buy signal.
Resistance Level: This is a price level where a stock tends to find selling interest, preventing it from rising further. If RSI is showing an overbought condition (above 70) and the price is near or at a strong resistance level, it could be a signal to sell or short the asset.
Disclaimer:
I am not a SEBI registered. The information provided here is for learning purposes only and should not be interpreted as financial advice. Consider the broader market context and consult with a qualified financial advisor before making investment decisions.


JK PAPER - swing trade Entry - cmp
SL - 3%
Tgt - 536
This is not a recommendation on buy/sell. Please consult your financial advisor before any investment.


JK PAPER - My observation & overview! - 30% upside!!!Overview & Observation:
1. Moving with Weekly Demand.
2. Good volume support.
3. Strong trendline support
4. Healthy breakout candle.
Trade Plan:
1. It is already close to targets for the structure it gave BO.
2. Either wait for a retracement for buying or ride the trend with an aggressive entry at CMP with 10% as a safe SL.
- Stay tuned for further insights, updates and trade safely!
- If you liked the analysis, don't forget to leave a comment and boost the post. Happy trading!
Disclaimer: This is NOT a buy/sell recommendation. This post is meant for learning purposes only. Please, do your due diligence before investing.
Thanks & Regards,
Anubrata Ray

JK PAPE ON next moveWhat Is the Cypher Chart Pattern?
The Cypher is a type of harmonic pattern used by traders to identify potential buying and selling opportunities in the markets. Specifically, it’s used to help find areas where a reversal may occur.
The pattern is made up of five swing points (X, A, B, C, D) and four legs (XA, AB, BC, CD). It’s characterised by an “M” shape when bullish and a “W” shape if bearish. Traders typically place orders at D to catch the potential reversal.
Like other harmonic patterns, the Cypher requires that specific Fibonacci ratios be met before it is traded. However, the ratios used for the Cypher are relatively unique, which makes the formation one of the less common harmonic patterns.
The Cypher is also more advanced than other patterns, like the Gartley, Bat, or Butterfly, so you may need to spend some extra time learning how to recognise and trade it effectively. Once you master the skill, however, you’ll find that the Cypher can be a valuable addition to your trading arsenal.
JK paper has formed a cypher pattern, and expecting 411 and 550 levels in coming times
it also indicate start of 3rd wave of elliot

JKPAPERATH Breakout .
Good Volume Buildup.
Above all Key EMA.
Good for Short Term.
Do Like ,Comment , Follow for regular Updates...
Keep Learning ,Keep Earning...
Disclaimer : This is not a Buy or Sell recommendation. I am not SEBI Registered. Please consult your financial advisor before making any investments . This is for Educational purpose only.

JK PaperLooks good to make a next leg of rally as the weekly candle closes above Gann levels 388
Technically looking great in all the lower time frames and the higher timeframes isbveign posted here just for the clairity
SL below 385 levels and targets are marked as per the blue horizontal lines.

RSI looks sufficient for the answer.hi @bhikhu65
Since march 20 to recent high it gave approx. 650% returns with a single indicator recently it again touched that so I don't want to look more , this single thing looks enough for me.
Choose your decision accordingly.
All the best.
Gratify if you appreciate the practice then you can like it, share it and
If you want me to investigate any chart for you then would cherish doing that for you.
Thank you for your time and support.
Stay safe.

JK Paper Positional Pick (Duration few weeks)JK Paper Positional Pick (Duration few weeks)
Buy above 449
Targets : 680
Stop Loss : below 283

JK PAPER LTD SWING TRADE IDEAJK PAPER LTD gave symmetrical triangle breakout with gud volume yesterday and closed abv weekly resistance zone with strong bullish candle can look for swing trade with ur prefered RR.

Jk papers buy buy buyJk papers buy buy buy
Super strong technically
Super strong fundamentally
Enjoy

JKPAPERStock name = JK Paper Limited.
Weekly chart setup
Chart is self explanatory. Levels of breakout, possible up-moves (where stock may find resistances) and support (close below which, setup will be invalidated) are clearly defined.
Master Score = C
Mediocre earnings and poor price performance make this a stock that still needs to prove itself.
Disclaimer: This is for demonstration and educational purpose only. this is not buying and selling recommendations. I am not SEBI registered. please consult your financial advisor before taking any trade.

JK Paper Looking GoodJk Paper is forming Triangle Pattern Bullish if breaks Trendline. Only For Educational Purpose.
