Jsw energy fibonachi supports Jsw has taken support of 418 (golden ration 61.8) and then at 490(ratio .5) so 485 is the stop loss and it is ready for target of 595
Cmo 512
Next report date
—
Report period
—
EPS estimate
—
Revenue estimate
—
12.45 INR
19.51 B INR
115.75 B INR
507.05 M
About JSW ENERGY LTD
Sector
Industry
CEO
Sharad Mahendra
Website
Headquarters
Mumbai
Founded
1994
ISIN
INE121E01018
FIGI
BBG000NT11F0
JSW Energy Ltd. engages in the business of power generation. It operates through the following business segments: Power Generation, Power Transmission, and Power Trading. The company was founded by Om Prakash Jindal on March 10, 1994 and is headquartered in Mumbai, India.
Related stocks

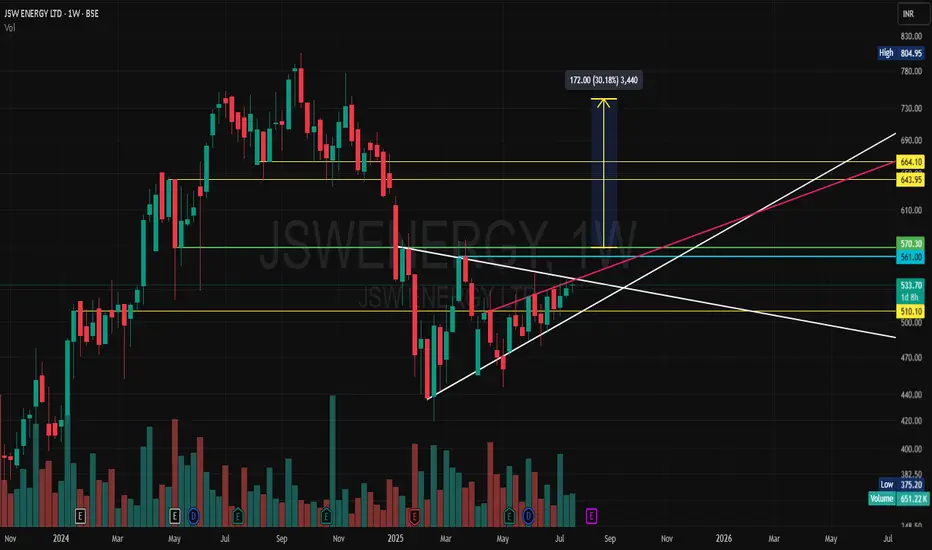
jsw energysymmertrical triangle (In white line)
Red Line inverse H&S Neckline
Blue Line Double bottom neckline.
Green line is also neckline can be resistance tgt above yellow lines and above
JSW ENERGY LONG TERM SWINGJSW Energy (JSWENERGY) - Trading Idea
Action: Buy
Buy Above: ₹527
Stop Loss (SL): ₹490
Target (TR): ₹580 / ₹640 / ₹700 / ₹754


JSW Energy trying to gain some energy and momentum.JSW Energy Ltd. engages in the business of power generation. It operates through the following business segments: Power Generation, Power Transmission, and Power Trading. The company was founded by Om Prakash Jindal on March 10, 1994 and is headquartered in Mumbai, India.
JSW Energy Ltd. Closing p
JSWENERGY Investment OpportunityWe can invest from current for short term.
Target 1: 530 and Target 2: 600
Tenure: 6 months
I am not SEBI registered so trade at your own risk.

JSW Energy bulish pattern JSW Energy bulish pattern cmp 484 on 09.2.25 it can agin retest and reverse for up side .


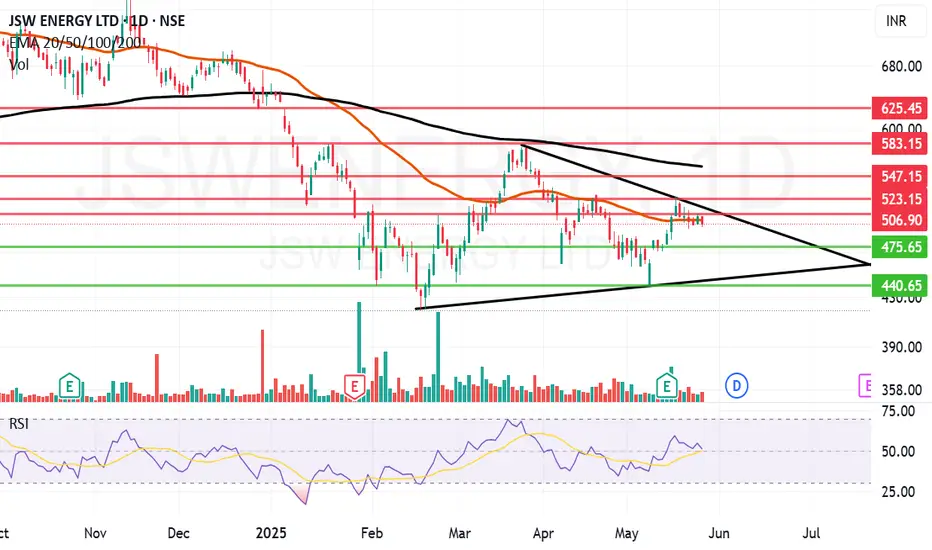
JSW Energy Ltd Analysis: Head and Shoulders Formation and Potent
Description :
The Head and Shoulders pattern on JSW Energy's daily chart suggests a potential reversal to the downside. The key support level at 601.55 is being tested, and if it breaks, we could see a further decline towards 520.60 . The pattern's key components are marked:
Left Should

See all ideas
Summarizing what the indicators are suggesting.
Neutral
SellBuy
Strong sellStrong buy
Strong sellSellNeutralBuyStrong buy
Neutral
SellBuy
Strong sellStrong buy
Strong sellSellNeutralBuyStrong buy
Neutral
SellBuy
Strong sellStrong buy
Strong sellSellNeutralBuyStrong buy
An aggregate view of professional's ratings.
Neutral
SellBuy
Strong sellStrong buy
Strong sellSellNeutralBuyStrong buy
Neutral
SellBuy
Strong sellStrong buy
Strong sellSellNeutralBuyStrong buy
Neutral
SellBuy
Strong sellStrong buy
Strong sellSellNeutralBuyStrong buy
Displays a symbol's price movements over previous years to identify recurring trends.
J
JSWH5182840
JSW Hydro Energy Limited 4.125% 18-MAY-2031Yield to maturity
5.91%
Maturity date
May 18, 2031
See all JSWENERGY bonds
Frequently Asked Questions
The current price of JSWENERGY is 511.65 INR — it has decreased by −0.66% in the past 24 hours. Watch JSW ENERGY LTD stock price performance more closely on the chart.
Depending on the exchange, the stock ticker may vary. For instance, on NSE exchange JSW ENERGY LTD stocks are traded under the ticker JSWENERGY.
JSWENERGY stock has fallen by −3.73% compared to the previous week, the month change is a −3.81% fall, over the last year JSW ENERGY LTD has showed a −29.77% decrease.
We've gathered analysts' opinions on JSW ENERGY LTD future price: according to them, JSWENERGY price has a max estimate of 700.00 INR and a min estimate of 423.00 INR. Watch JSWENERGY chart and read a more detailed JSW ENERGY LTD stock forecast: see what analysts think of JSW ENERGY LTD and suggest that you do with its stocks.
JSWENERGY reached its all-time high on Sep 24, 2024 with the price of 804.90 INR, and its all-time low was 33.65 INR and was reached on Aug 6, 2013. View more price dynamics on JSWENERGY chart.
See other stocks reaching their highest and lowest prices.
See other stocks reaching their highest and lowest prices.
JSWENERGY stock is 4.81% volatile and has beta coefficient of 1.05. Track JSW ENERGY LTD stock price on the chart and check out the list of the most volatile stocks — is JSW ENERGY LTD there?
Today JSW ENERGY LTD has the market capitalization of 893.98 B, it has increased by 0.22% over the last week.
Yes, you can track JSW ENERGY LTD financials in yearly and quarterly reports right on TradingView.
JSW ENERGY LTD is going to release the next earnings report on Nov 14, 2025. Keep track of upcoming events with our Earnings Calendar.
JSWENERGY earnings for the last quarter are 4.35 INR per share, whereas the estimation was 4.68 INR resulting in a −6.99% surprise. The estimated earnings for the next quarter are 6.25 INR per share. See more details about JSW ENERGY LTD earnings.
JSWENERGY net income for the last quarter is 7.43 B INR, while the quarter before that showed 4.08 B INR of net income which accounts for 82.11% change. Track more JSW ENERGY LTD financial stats to get the full picture.
Yes, JSWENERGY dividends are paid annually. The last dividend per share was 2.00 INR. As of today, Dividend Yield (TTM)% is 0.39%. Tracking JSW ENERGY LTD dividends might help you take more informed decisions.
JSW ENERGY LTD dividend yield was 0.37% in 2024, and payout ratio reached 17.87%. The year before the numbers were 0.38% and 19.05% correspondingly. See high-dividend stocks and find more opportunities for your portfolio.
As of Aug 3, 2025, the company has 10.26 K employees. See our rating of the largest employees — is JSW ENERGY LTD on this list?
EBITDA measures a company's operating performance, its growth signifies an improvement in the efficiency of a company. JSW ENERGY LTD EBITDA is 65.92 B INR, and current EBITDA margin is 44.34%. See more stats in JSW ENERGY LTD financial statements.
Like other stocks, JSWENERGY shares are traded on stock exchanges, e.g. Nasdaq, Nyse, Euronext, and the easiest way to buy them is through an online stock broker. To do this, you need to open an account and follow a broker's procedures, then start trading. You can trade JSW ENERGY LTD stock right from TradingView charts — choose your broker and connect to your account.
Investing in stocks requires a comprehensive research: you should carefully study all the available data, e.g. company's financials, related news, and its technical analysis. So JSW ENERGY LTD technincal analysis shows the sell today, and its 1 week rating is neutral. Since market conditions are prone to changes, it's worth looking a bit further into the future — according to the 1 month rating JSW ENERGY LTD stock shows the buy signal. See more of JSW ENERGY LTD technicals for a more comprehensive analysis.
If you're still not sure, try looking for inspiration in our curated watchlists.
If you're still not sure, try looking for inspiration in our curated watchlists.