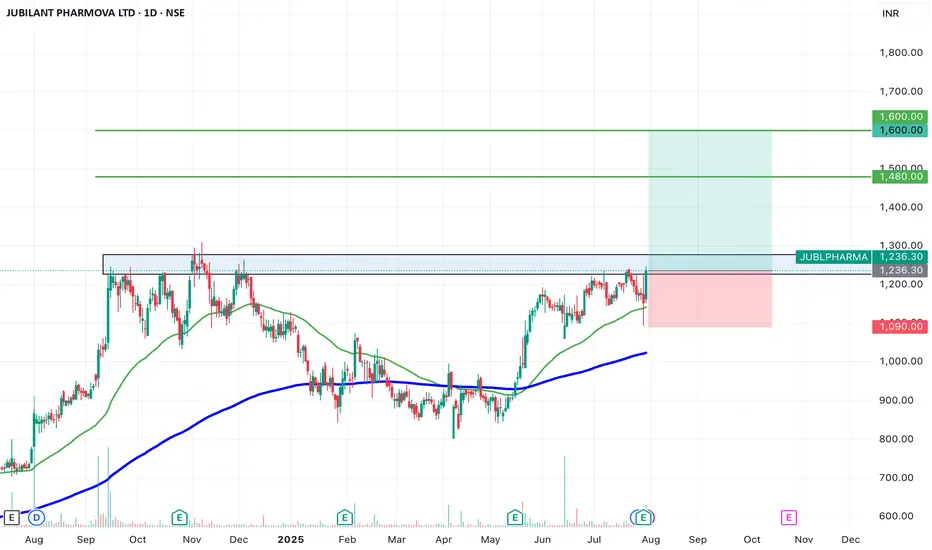
SWING IDEA - JUBILANT PHARMOVAJubilant Pharmova , a diversified pharmaceutical company focused on CRAMS and specialty pharma, is presenting a strong swing opportunity backed by a major pattern breakout and volume confirmation.
Reasons are listed below :
Breakout from an Inverted Head & Shoulders pattern after over a year of consolidation
Attempting breakout above 1250, a key resistance zone with multiple rejections in the past
Strong marubozu candle on the daily chart with a notable volume spike, signaling conviction
Trading near all-time highs, and comfortably above key EMAs, reinforcing trend strength
Target : 1480 // 1600
Stoploss : weekly close below 1090
DISCLAIMER -
Decisions to buy, sell, hold or trade in securities, commodities and other investments involve risk and are best made based on the advice of qualified financial professionals. Any trading in securities or other investments involves a risk of substantial losses. The practice of "Day Trading" involves particularly high risks and can cause you to lose substantial sums of money. Before undertaking any trading program, you should consult a qualified financial professional. Please consider carefully whether such trading is suitable for you in light of your financial condition and ability to bear financial risks. Under no circumstances shall we be liable for any loss or damage you or anyone else incurs as a result of any trading or investment activity that you or anyone else engages in based on any information or material you receive through TradingView or our services.
@visionary.growth.insights
JUBLPHARMA trade ideas
JUBILANT PHARMOVA - BREAKOUTNSE:JUBLPHARMA Breakout stock with momentum and bullish on multiple timeframes.

JUBLPHARMARSI + Inside Bar Candle
RSI support taken @ 60
Inside Bar Candle level
Resistance 1172
Support 1090
Resistance 1195 Once cross
Then expected level 1309

SWING IDEA - JUBILANT PHARMOVAJubilant Pharmova , a diversified global pharmaceutical and life sciences company, offers an attractive swing trade setup with the following technical factors.
Reasons are listed below :
Break of 1000 Resistance : The price has decisively broken above the significant 1000 level and is sustaining, indicating strength and bullish momentum.
Consolidation Breakout : The stock is breaking out of a consolidation phase lasting over 6 years, suggesting a potential long-term uptrend.
Volume Spike : Increased trading volumes highlight growing investor interest and support the breakout.
Engulfing Candle : A bullish engulfing candle on the weekly timeframe reflects strong buying sentiment.
Target - 1450 // 1590
Stoploss - weekly close below 1030
DISCLAIMER -
Decisions to buy, sell, hold or trade in securities, commodities and other investments involve risk and are best made based on the advice of qualified financial professionals. Any trading in securities or other investments involves a risk of substantial losses. The practice of "Day Trading" involves particularly high risks and can cause you to lose substantial sums of money. Before undertaking any trading program, you should consult a qualified financial professional. Please consider carefully whether such trading is suitable for you in light of your financial condition and ability to bear financial risks. Under no circumstances shall we be liable for any loss or damage you or anyone else incurs as a result of any trading or investment activity that you or anyone else engages in based on any information or material you receive through TradingView or our services.
@visionary.growth.insights

JUBILANT PHARMOVA long consolidation BO & retest doneThe stock has shown a breakout, and the retest has been completed.
It looks poised to rise significantly, with a stop-loss set at the strong monthly candle close below 780.


Jubilant Pharmova LtdSupport and Resistance Levels: In technical analysis, support and resistance levels are significant price levels where buying or selling interest tends to be strong. They are identified based on previous price levels where the price has shown a tendency to reverse or find support.

JUBLPHA S/RSupport and Resistance Levels:
Support Levels: These are price points (green line/shade) where a downward trend may be halted due to a concentration of buying interest. Imagine them as a safety net where buyers step in, preventing further decline.
Resistance Levels: Conversely, resistance levels (red line/shade) are where upward trends might stall due to increased selling interest. They act like a ceiling where sellers come in to push prices down.
Breakouts:
Bullish Breakout: When the price moves above resistance, it often indicates strong buying interest and the potential for a continued uptrend. Traders may view this as a signal to buy or hold.
Bearish Breakout: When the price falls below support, it can signal strong selling interest and the potential for a continued downtrend. Traders might see this as a cue to sell or avoid buying.
20 EMA (Exponential Moving Average):
Above 20 EMA: If the stock price is above the 20 EMA, it suggests a potential uptrend or bullish momentum.
Below 20 EMA: If the stock price is below the 20 EMA, it indicates a potential downtrend or bearish momentum.
Trendline: A trendline is a straight line drawn on a chart to represent the general direction of a data point set.
Uptrend Line: Drawn by connecting the lows in an upward trend. Indicates that the price is moving higher over time. Acts as a support level, where prices tend to bounce upward.
Downtrend Line: Drawn by connecting the highs in a downward trend. Indicates that the price is moving lower over time. It acts as a resistance level, where prices tend to drop.
RSI: RSI readings greater than the 70 level are overbought territory, and RSI readings lower than the 30 level are considered oversold territory.
Combining RSI with Support and Resistance:
Support Level: This is a price level where a stock tends to find buying interest, preventing it from falling further. If RSI is showing an oversold condition (below 30) and the price is near or at a strong support level, it could be a good buy signal.
Resistance Level: This is a price level where a stock tends to find selling interest, preventing it from rising further. If RSI is showing an overbought condition (above 70) and the price is near or at a strong resistance level, it could be a signal to sell or short the asset.
Disclaimer:
I am not a SEBI registered. The information provided here is for learning purposes only and should not be interpreted as financial advice. Consider the broader market context and consult with a qualified financial advisor before making investment decisions.

JUBILANT PHARMA LTD These are swing ideas which you can add your watchlist and analysis for yourself !
Keep on your radar!
i am not sebi ragister!

Jubilant pharma Stock:- jubilant pharma
Over all trend :- positive
Setup :- breaks the 6 year high with good. Volumes in weekly also monthy time frame
Buy :- at current market price with split form of your capital don't invest in single go
Stoploss must be intact at weekly previous low ...
Note :- please consult your advisor before investing in stocks which i share with you.

ATH breakout in all time framesGood volume buildup in daily as well as in weekly timeframe.
Highest volume buildup in weekly timeframe.
Fundamentals are OK.
FII & DII stakes are up.
Sector rotation - Pharma.
NOTE: I do my analysis, do yours before trade.


Jubilant Pharmova Ltd intraday level for 20th Aug #JUBLPHARMA Jubilant Pharmova Ltd intraday level for 20th Aug #JUBLPHARMA
Buying may witness above 911
Support area 899. Below ignoring buying momentum for intraday
Selling may witness below 899
Resistance area 911. Above ignoring selling momentum for intraday
Charts for Educational purposes only.
Please follow strict stop loss and risk reward if you follow the level.
Thanks,
V Trade Point

Darvas Box Strategy - Breakout StockDisclaimer: I am Not SEBI Register adviser, please take advise from your financial adviser before investing in any stocks.
Stock has given break out buy above the High and do not forget to keep stop loss best suitable for swing trading.
Be Discipline, because discipline is the key to Success in Stock Market.

Jubilant Pharmova Ltd: Breakout with Strong Uptrend➡ Bullish breakout above ₹876 with strong volume support
➡ Ascending trend line providing robust support
➡ Strong uptrend since November 2023

Jubilant Pharmova Ltd:Here's an analysis of the provided stock chart for Jubilant Pharmova Ltd:
1. **Price Movement**:
- The stock is currently trading at 854.85 INR, up by 9.75 INR (+1.15%).
- The stock experienced a significant upward movement with a large green candlestick, indicating a strong bullish sentiment.
2. **Support and Resistance Levels**:
- **Resistance**: Around 859.50 INR. The stock has tested this level multiple times but has not yet broken through.
- **Support**: Around 787.11 INR. This is a previous resistance level that now acts as support.
3. **Moving Averages**:
- **EMA (20)**: The stock is trading above the 20-day Exponential Moving Average (EMA), indicating an upward trend.
4. **Volume**:
- There was a significant increase in volume during the large upward movement, which suggests strong buying interest.
5. **RSI (Relative Strength Index)**:
- The RSI is around 71.41, which is above the 70 mark, indicating that the stock might be overbought and could be due for a correction.
Key Takeaways:
- The stock is in a strong uptrend but faces resistance around 859.50 INR.
- The increase in volume during the upward movement suggests strong buying interest.
- The RSI indicates that the stock might be overbought, so a short-term correction could be possible.
Possible Actions:
- If you are holding the stock**: Consider watching for a breakout above the 859.50 INR resistance level for further gains or a potential pullback to the 787.11 INR support level for adding more.
- **If you are looking to buy**: It might be prudent to wait for a pullback to the support level or a confirmed breakout above the resistance level.
Always consider your investment strategy and risk tolerance before making any trading decisions.

JUBLPHARMA - Strong breakoutThe chart is self-explanatory as always :)
⚠️Disclaimer: We are not registered advisors. The views expressed here are merely personal opinions. Irrespective of the language used, Nothing mentioned here should be considered as advice or recommendation. Please consult with your financial advisors before making any investment decisions. Like everybody else, we too can be wrong at times ✌🏻

JUBLPHARMA Break EMA (200), DARVAS BOX THRORY, STRONG RESISTANCEJubilant pharma Break multiple type of Breakout for Ema 200, Strong Resistance and Darvas Box
if sustain Above 520 after good moment for upside seen possible target 597-697-797-899-1038+++

Jubilant Pharma21/07/2024
Jubilant Pharma
CMP: 749.55
BO above 878
Target:1037
SL: 701
Information is only for study purpose

Good Weekly breakout in Jubilant Pharmova LtdClean breakout from Jublpharma in weekly time time frame, Inverted H&S pattern formation in demand level..
Entry level 510
Expected target 631
SL 448
Note*- The views expressed are based on personal observations/opinions. Please do you own research before making any trading decisions.

JUBLPHARMA weekly chart Golden crossover
round bottom format
volume growth
RSI above 60 daily / weekly / monthly
EMA in line 21 / 50 /200
Resistance 618
Support 495
Expected level

Learn and how to find a Rectangle pattern breakout trade?As you see on the chart price is stuck in a rectangle pattern so wee should look for a long trade because price want to go in long directional trade .
But we need to know that what should we our proper entry and exit , without knowing target and exit we shouldn't enter in such type of trade . we have to protect our capital also then we survive in this journey of being profitable trader's.
