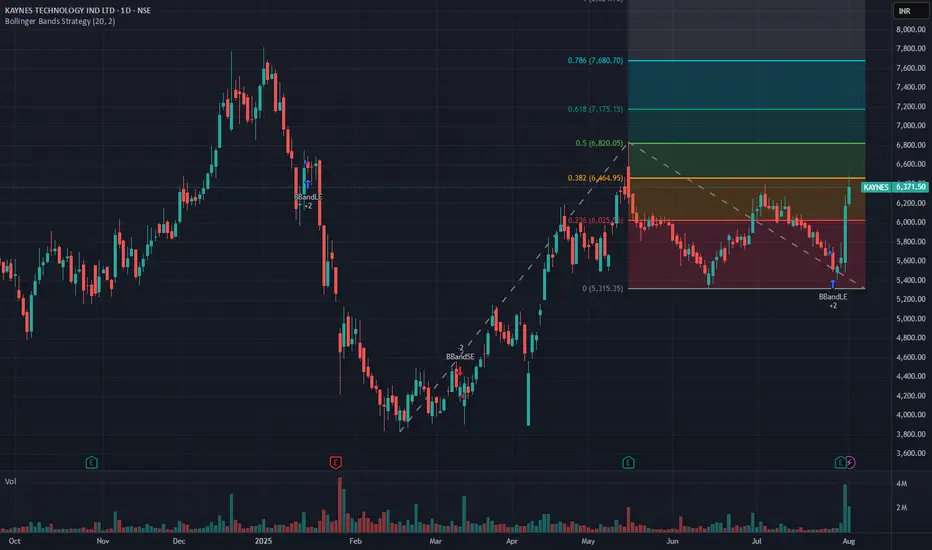
Swing trading oppurtunity in Kaynes TechnologyKaynes Tech started an uptrend after making an bottom at 3800 and made an temporary top at 6800. Post that there was again an meaningful retracement to 5400 which is around 50% of the up move from 3800.
Now its is making an 2nd attempt to break 0.382 on trend based fib extension tool and
Next report date
—
Report period
—
EPS estimate
—
Revenue estimate
—
49.55 INR
2.93 B INR
27.22 B INR
28.19 M
About KAYNES TECHNOLOGY IND LTD
Sector
Industry
CEO
Rajesh Sharma
Website
Headquarters
Mysore
Founded
1988
ISIN
INE918Z01012
FIGI
BBG01BFCG7G1
Kaynes Technology India Ltd. engages in design and manufacturing of advanced electronic modules and solutions. The company was founded in 1988 and is headquartered in Mysore, India.
Related stocks
Kaynes_Rejection at 20 Daily EMA_ShortPrice rejection from 20 DEMA and close below 50 DEMA.
Probable Short candidate. Target Previous Swing Low 5370
SL yesterday's high or close above 20 DEMA.
Enter only when the hourly chart pulls back

KAYNES | Buy @LTP | SL below 5000 | Targets 6250, 6835, 7760Disclaimer:
This is not financial advice. Please do your own research or consult with a financial advisor before making any investment decisions. Investments in stocks can be risky and may result in loss of capital.

KAYNES 1DA cup and handle pattern formation is observed the breakout has seen with a huge volumes I think there will be a good rally in future
The information provided is for educational purposes only and not financial advice. Stock investments carry market risks, and past performance does not guarantee

Kaynes Technology – Reversal or More Weakness?Kaynes Tech is in Stage 4 decline, but selling pressure is easing, hinting at a potential Stage 1 base.
🔹 Key Levels: ₹3825 (support), ₹5000 (resistance)
🔹 Entry: Above ₹5000 with strong volume
🔹 Target: ₹6000+ (if Stage 2 starts)
🔹 Stop Loss: ₹4500 (if breakout fails)
📌 Wait for trend confirmatio

KAYNES TECHNOLOGY IND LTD SWING TRADE📊 Price Action & Trend Analysis
Analyzing market trends using price action, key support/resistance levels, and candlestick patterns to identify high-probability trade setups.
Always follow the trend and manage risk wisely!
Price Action Analysis Interprets Market Movements Using Patterns And Trend

KAYNES TECHNOLOGY IND LTD S/RSupport and Resistance Levels:
Support Levels: These are price points (green line/shade) where a downward trend may be halted due to a concentration of buying interest. Imagine them as a safety net where buyers step in, preventing further decline.
Resistance Levels: Conversely, resistance levels (re

Kaynes - Narrow Range CandlesKaynes Technology India Ltd.
Narrow Range Candles
High Delivery Quantity this week.
Within 52 Week Zone.
Outperforming Stock.
Disclaimer:
For educational purpose only.
Please do your own research before taking any trades.
Happy Trading!

KAYNES: Just a good chart.Overall price is able to move up continiously since it listed.
Does not hurt to add some small quantity with small SL.

Kaynes Trendline supportKaynes technology taking good support from the trendline and breaking its all time high.
The support from the trendline indicates a good uptrend, making a good higher high.

See all ideas
Summarizing what the indicators are suggesting.
Neutral
SellBuy
Strong sellStrong buy
Strong sellSellNeutralBuyStrong buy
Neutral
SellBuy
Strong sellStrong buy
Strong sellSellNeutralBuyStrong buy
Neutral
SellBuy
Strong sellStrong buy
Strong sellSellNeutralBuyStrong buy
An aggregate view of professional's ratings.
Neutral
SellBuy
Strong sellStrong buy
Strong sellSellNeutralBuyStrong buy
Neutral
SellBuy
Strong sellStrong buy
Strong sellSellNeutralBuyStrong buy
Neutral
SellBuy
Strong sellStrong buy
Strong sellSellNeutralBuyStrong buy
Displays a symbol's price movements over previous years to identify recurring trends.
Frequently Asked Questions
The current price of KAYNES is 5,815.50 INR — it has decreased by −4.49% in the past 24 hours. Watch KAYNES TECHNOLOGY IND LTD stock price performance more closely on the chart.
Depending on the exchange, the stock ticker may vary. For instance, on NSE exchange KAYNES TECHNOLOGY IND LTD stocks are traded under the ticker KAYNES.
KAYNES stock has fallen by −6.24% compared to the previous week, the month change is a −4.19% fall, over the last year KAYNES TECHNOLOGY IND LTD has showed a 36.19% increase.
We've gathered analysts' opinions on KAYNES TECHNOLOGY IND LTD future price: according to them, KAYNES price has a max estimate of 7,878.00 INR and a min estimate of 5,390.00 INR. Watch KAYNES chart and read a more detailed KAYNES TECHNOLOGY IND LTD stock forecast: see what analysts think of KAYNES TECHNOLOGY IND LTD and suggest that you do with its stocks.
KAYNES reached its all-time high on Jan 1, 2025 with the price of 7,822.00 INR, and its all-time low was 666.80 INR and was reached on Dec 26, 2022. View more price dynamics on KAYNES chart.
See other stocks reaching their highest and lowest prices.
See other stocks reaching their highest and lowest prices.
KAYNES stock is 5.48% volatile and has beta coefficient of 1.52. Track KAYNES TECHNOLOGY IND LTD stock price on the chart and check out the list of the most volatile stocks — is KAYNES TECHNOLOGY IND LTD there?
Today KAYNES TECHNOLOGY IND LTD has the market capitalization of 407.42 B, it has decreased by −3.07% over the last week.
Yes, you can track KAYNES TECHNOLOGY IND LTD financials in yearly and quarterly reports right on TradingView.
KAYNES TECHNOLOGY IND LTD is going to release the next earnings report on Nov 4, 2025. Keep track of upcoming events with our Earnings Calendar.
KAYNES earnings for the last quarter are 11.12 INR per share, whereas the estimation was 9.47 INR resulting in a 17.46% surprise. The estimated earnings for the next quarter are 14.30 INR per share. See more details about KAYNES TECHNOLOGY IND LTD earnings.
KAYNES TECHNOLOGY IND LTD revenue for the last quarter amounts to 6.74 B INR, despite the estimated figure of 7.55 B INR. In the next quarter, revenue is expected to reach 9.23 B INR.
KAYNES net income for the last quarter is 746.12 M INR, while the quarter before that showed 1.16 B INR of net income which accounts for −35.79% change. Track more KAYNES TECHNOLOGY IND LTD financial stats to get the full picture.
No, KAYNES doesn't pay any dividends to its shareholders. But don't worry, we've prepared a list of high-dividend stocks for you.
EBITDA measures a company's operating performance, its growth signifies an improvement in the efficiency of a company. KAYNES TECHNOLOGY IND LTD EBITDA is 4.57 B INR, and current EBITDA margin is 15.09%. See more stats in KAYNES TECHNOLOGY IND LTD financial statements.
Like other stocks, KAYNES shares are traded on stock exchanges, e.g. Nasdaq, Nyse, Euronext, and the easiest way to buy them is through an online stock broker. To do this, you need to open an account and follow a broker's procedures, then start trading. You can trade KAYNES TECHNOLOGY IND LTD stock right from TradingView charts — choose your broker and connect to your account.
Investing in stocks requires a comprehensive research: you should carefully study all the available data, e.g. company's financials, related news, and its technical analysis. So KAYNES TECHNOLOGY IND LTD technincal analysis shows the sell today, and its 1 week rating is buy. Since market conditions are prone to changes, it's worth looking a bit further into the future — according to the 1 month rating KAYNES TECHNOLOGY IND LTD stock shows the buy signal. See more of KAYNES TECHNOLOGY IND LTD technicals for a more comprehensive analysis.
If you're still not sure, try looking for inspiration in our curated watchlists.
If you're still not sure, try looking for inspiration in our curated watchlists.