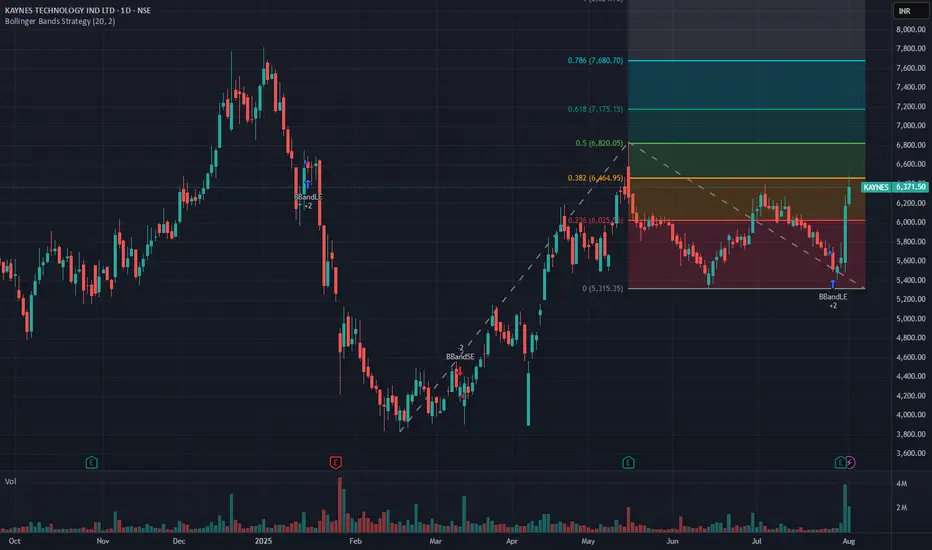
Swing trading oppurtunity in Kaynes TechnologyKaynes Tech started an uptrend after making an bottom at 3800 and made an temporary top at 6800. Post that there was again an meaningful retracement to 5400 which is around 50% of the up move from 3800.
Now its is making an 2nd attempt to break 0.382 on trend based fib extension tool and the point to be noted is that its doing so with good volumes.
Current up move is supported by positive earnings surprise which was the case in the last quarter too.
This presents us a long swing trade at current levels, with targets provided by the fib extension tool. Stop loss should be the fib level below which provides us a decent risk to reward.
Disclaimer- This post is for educational purpose and not a financial advice, do consult your financial advisor before investing in financial markets.
KAYNES trade ideas
Kaynes_Rejection at 20 Daily EMA_ShortPrice rejection from 20 DEMA and close below 50 DEMA.
Probable Short candidate. Target Previous Swing Low 5370
SL yesterday's high or close above 20 DEMA.
Enter only when the hourly chart pulls back

KAYNES | Buy @LTP | SL below 5000 | Targets 6250, 6835, 7760Disclaimer:
This is not financial advice. Please do your own research or consult with a financial advisor before making any investment decisions. Investments in stocks can be risky and may result in loss of capital.

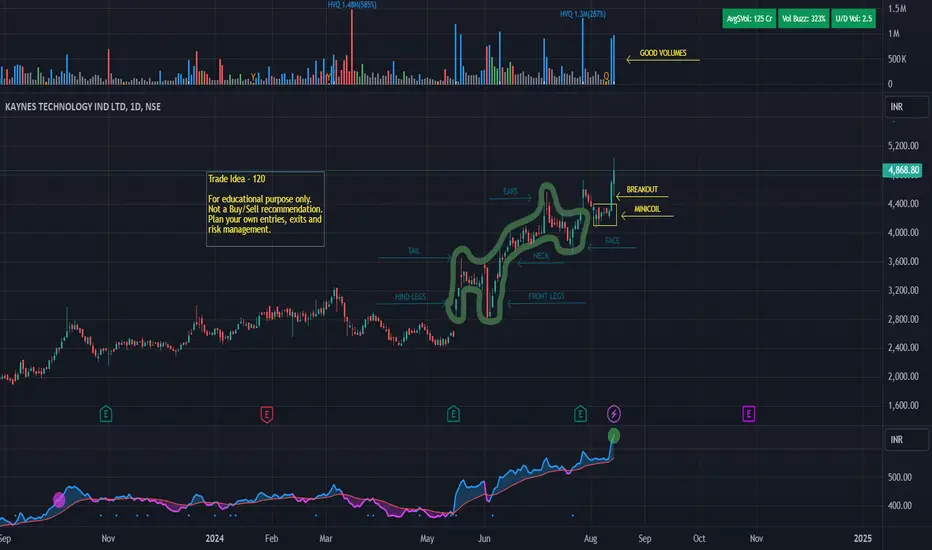
KAYNES 1DA cup and handle pattern formation is observed the breakout has seen with a huge volumes I think there will be a good rally in future
The information provided is for educational purposes only and not financial advice. Stock investments carry market risks, and past performance does not guarantee future results. Always conduct your own research and consult a financial advisor before making investment decisions. We are not responsible for any losses incurred

Kaynes Technology – Reversal or More Weakness?Kaynes Tech is in Stage 4 decline, but selling pressure is easing, hinting at a potential Stage 1 base.
🔹 Key Levels: ₹3825 (support), ₹5000 (resistance)
🔹 Entry: Above ₹5000 with strong volume
🔹 Target: ₹6000+ (if Stage 2 starts)
🔹 Stop Loss: ₹4500 (if breakout fails)
📌 Wait for trend confirmation before entry.
Disclaimer: Educational only, not financial advice. Do your research before investing.

KAYNES TECHNOLOGY IND LTD SWING TRADE📊 Price Action & Trend Analysis
Analyzing market trends using price action, key support/resistance levels, and candlestick patterns to identify high-probability trade setups.
Always follow the trend and manage risk wisely!
Price Action Analysis Interprets Market Movements Using Patterns And Trends On Price Charts.
👉👉👉Follow us for Live Market Views/Trades/Analysis/News Updates.

KAYNES TECHNOLOGY IND LTD S/RSupport and Resistance Levels:
Support Levels: These are price points (green line/shade) where a downward trend may be halted due to a concentration of buying interest. Imagine them as a safety net where buyers step in, preventing further decline.
Resistance Levels: Conversely, resistance levels (red line/shade) are where upward trends might stall due to increased selling interest. They act like a ceiling where sellers come in to push prices down.
Breakouts:
Bullish Breakout: When the price moves above resistance, it often indicates strong buying interest and the potential for a continued uptrend. Traders may view this as a signal to buy or hold.
Bearish Breakout: When the price falls below support, it can signal strong selling interest and the potential for a continued downtrend. Traders might see this as a cue to sell or avoid buying.
MA Ribbon (EMA 20, EMA 50, EMA 100, EMA 200) :
Above EMA: If the stock price is above the EMA, it suggests a potential uptrend or bullish momentum.
Below EMA: If the stock price is below the EMA, it indicates a potential downtrend or bearish momentum.
Trendline: A trendline is a straight line drawn on a chart to represent the general direction of a data point set.
Uptrend Line: Drawn by connecting the lows in an upward trend. Indicates that the price is moving higher over time. Acts as a support level, where prices tend to bounce upward.
Downtrend Line: Drawn by connecting the highs in a downward trend. Indicates that the price is moving lower over time. It acts as a resistance level, where prices tend to drop.
Disclaimer:
I am not a SEBI registered. The information provided here is for learning purposes only and should not be interpreted as financial advice. Consider the broader market context and consult with a qualified financial advisor before making investment decisions.

Kaynes - Narrow Range CandlesKaynes Technology India Ltd.
Narrow Range Candles
High Delivery Quantity this week.
Within 52 Week Zone.
Outperforming Stock.
Disclaimer:
For educational purpose only.
Please do your own research before taking any trades.
Happy Trading!

KAYNES: Just a good chart.Overall price is able to move up continiously since it listed.
Does not hurt to add some small quantity with small SL.

Kaynes Trendline supportKaynes technology taking good support from the trendline and breaking its all time high.
The support from the trendline indicates a good uptrend, making a good higher high.

Kaynes TechnologyAs can be seen there is good trendline support and breakout of a good resistance zone of 5800
Its engagement with government customers, defense organizations, and Tier 1 aerospace suppliers expands its market reach.
A good retest and again upward movement will shape it new trend

KAYNES S/R Support and Resistance Levels:
Support Levels: These are price points (green line/shade) where a downward trend may be halted due to a concentration of buying interest. Imagine them as a safety net where buyers step in, preventing further decline.
Resistance Levels: Conversely, resistance levels (red line/shade) are where upward trends might stall due to increased selling interest. They act like a ceiling where sellers come in to push prices down.
Breakouts:
Bullish Breakout: When the price moves above resistance, it often indicates strong buying interest and the potential for a continued uptrend. Traders may view this as a signal to buy or hold.
Bearish Breakout: When the price falls below support, it can signal strong selling interest and the potential for a continued downtrend. Traders might see this as a cue to sell or avoid buying.
20 EMA (Exponential Moving Average):
Above 20 EMA(50 EMA): If the stock price is above the 20 EMA, it suggests a potential uptrend or bullish momentum.
Below 20 EMA: If the stock price is below the 20 EMA, it indicates a potential downtrend or bearish momentum.
Trendline: A trendline is a straight line drawn on a chart to represent the general direction of a data point set.
Uptrend Line: Drawn by connecting the lows in an upward trend. Indicates that the price is moving higher over time. Acts as a support level, where prices tend to bounce upward.
Downtrend Line: Drawn by connecting the highs in a downward trend. Indicates that the price is moving lower over time. It acts as a resistance level, where prices tend to drop.
RSI: RSI readings greater than the 70 level are overbought territory, and RSI readings lower than the 30 level are considered oversold territory.
Combining RSI with Support and Resistance:
Support Level: This is a price level where a stock tends to find buying interest, preventing it from falling further. If RSI is showing an oversold condition (below 30) and the price is near or at a strong support level, it could be a good buy signal.
Resistance Level: This is a price level where a stock tends to find selling interest, preventing it from rising further. If RSI is showing an overbought condition (above 70) and the price is near or at a strong resistance level, it could be a signal to sell or short the asset.
Disclaimer:
I am not a SEBI registered. The information provided here is for learning purposes only and should not be interpreted as financial advice. Consider the broader market context and consult with a qualified financial advisor before making investment decisions.

kaynes Tech LongKaynes (Nse)
MTF Analysis
Kaynes Yearly Demand WIP 166
Kaynes 6 Month Demand Breakout 4095
Kaynes Qtrly Demand Breakout 4095
Kaynes Monthly Demand Breakout 5380
Kaynes Weekly DMIP 5050
Kaynes Daily Ddemand 4840
ENTRY 5050
SL 4566
RISK 484
Target 5978
REWARD POINT 928
Last High 5514
RR 1.92
RR 18%

Kaynes - Breakout AlertKaynes Technology Ind Ltd - NSE
Crossing All Time High
Crossing 52 Week High
High Trade and Delivery Quantity
Kaynes Technology India consolidated net profit rises 106.00% in the June 2024 quarter
mybs.in
Disclaimer:
For educational purpose only.
Please do your own research before taking any trades.
Happy Trading!
KAYNES TECH Ascending Triangle Breakout D.CClear cut Ascending Triangle Breakout on Daily Chart.
Too good for swing Trading.

Contracting triangle BOKaynes Tech looking good, just broke out from contracting triangle
SL @ 13%
Target @ 50%

Kaynes techBreakout happend in this stock.
Keep your risk and reward ratio according to your own preferances.
This is for educational purpose, do your own research before investing.

KAYNES : Charting a Promising Path - Bullish StructureKaynes, a notable entity in the market, is currently carving out a compelling narrative with its pronounced bullish structure, especially when observed on a larger time frame. This substantial positive chart pattern is capturing the attention of traders and investors alike, signaling potential opportunities for those looking at longer-term perspectives.
The bullish structure on the larger time frame suggests a sustained positive momentum in Kaynes. This pattern is often indicative of robust investor confidence and a favorable market sentiment, providing a strong foundation for potential growth.
Investors considering positions in Kaynes may find the current bullish structure appealing as it aligns with the company's potential for upward movements over an extended period. The significance of the larger time frame adds weight to the reliability of this bullish trend, offering a comprehensive view of the stock's growth potential.
As participants navigate this opportunity, conducting thorough research becomes crucial, encompassing both technical analysis and a deep dive into the fundamental aspects of Kaynes. Understanding the factors contributing to the bullish structure enhances the overall assessment of the stock's trajectory.
While embracing the optimism, prudent risk management remains paramount. Investors should stay informed about market conditions, monitor industry trends, and align their positions with individual risk tolerance. Seeking advice from financial professionals or advisors can offer valuable insights tailored to individual investment goals and risk profiles in light of Kaynes' pronounced bullish structure on larger time frames.


KAYNES - LONG for Highs KAYNES Technical Analysis 📈📉:
KAYNES is currently in the final stages of completing its corrective Wave 4, marked by the completion of the ABC wave structure. Anticipating a bullish move with the onset of Wave 5.
**Trade Recommendation:**
- **Action:** Initiate a Buy Call
- **Target Range:** 3045 to 3108
- **Stop Loss (SL):** Set at 2484
- **Risk-Reward Ratio:** 1:3.29
- **Expected Return:** 18%
Stay tuned for potential upward momentum as Wave 5 unfolds. Execute trades prudently and may the markets be in your favor! 🚀💼 #TechnicalAnalysis #StockTrading #KAYNES #InvestingStrategy

Kaynes technologiesRange breakout, Avwap breakout with rsi breakout. Stock is expected to continue its uptrend.

KAYNES 2474 | Kaynes Technology India Ltd | GOOD chart BO DONE52 WEEJ High / Low ₹ 2,966 / 625
Return over 1year 236 %
Return over 6months 75.9 %
Return over 3months 22.4 %
PROS
Company is expected to give good quarter
Debtor days have improved from 96.6 to 74.0 days.

KAYNES 2464 | Kaynes Technology India Ltd // ready for BOgood consolidation done ready for bo, wl
Market Cap ₹ 14,334 Cr. | Current Price ₹ 2,464
52 week High / Low ₹ 2,966 / 625 | Stock P/E 130
Book Value ₹ 174 | Dividend Yield 0.00 %
ROCE 21.5 % | ROE 16.3 % | Face Value ₹ 10.0
Promoter holding 63.6 % |
Current liabilities ₹ 508 Cr. | Total Assets ₹ 1,558 Cr.
Return over 1year 229 %
Return over 6months 72.6 %
Return over 3months 24.4 %
Return over 1month 3.58 %
kalpesh patel
