KFINTECHKfintech the giant is looking handsome hulk on weekly chart, Keep on radar, above 1190 ready for 1250, 1300, 1350, 1400, 1500 in few Months.
Next report date
—
Report period
—
EPS estimate
—
Revenue estimate
—
19.90 INR
3.33 B INR
11.28 B INR
76.80 M
About KFIN TECHNOLOGIES LTD
Sector
Industry
CEO
Venkata Satya Naga Nadella
Website
Headquarters
Hyderabad
ISIN
INE138Y01010
FIGI
BBG01C30KKB9
KFin Technologies Ltd. engages in the provision of software as a service based end-to-end transaction management, channel management, compliance solutions, data analytics, and digital services. It operates through the following segments: Registry Services, Data Processing Services, and Pension Services. The company was founded on June 8, 2017 and is headquartered in Hyderabad, India.
Related stocks

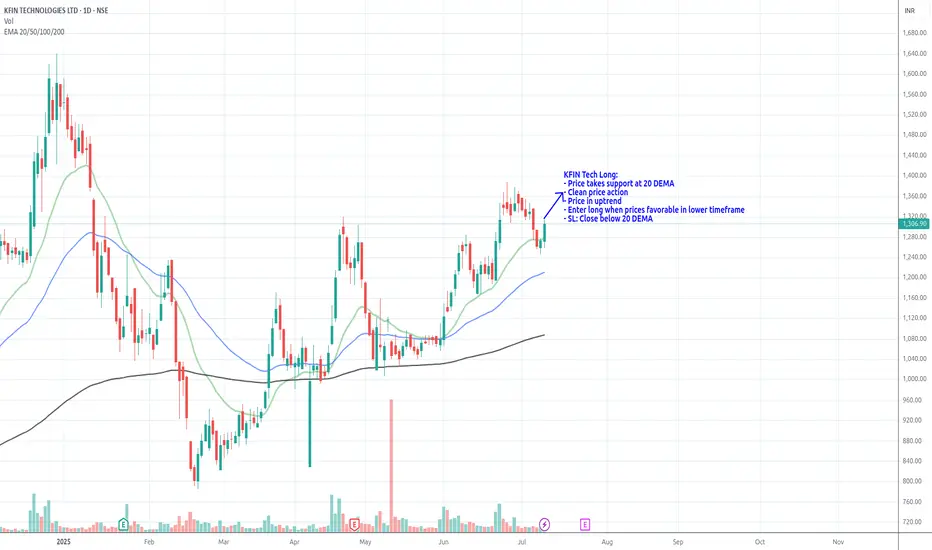
KFIN Tech_Long_Support @ 20DEMAKFIN Tech Long:
- Price takes support at 20 DEMA
- Clean price action
- Price in uptrend
- Enter long when prices favorable in lower timeframe
- SL: Close below 20 DEMA
Review and plan for 10th July 2025 Nifty future and banknifty future analysis and intraday plan.
Swing ideas.
This video is for information/education purpose only. you are 100% responsible for any actions you take by reading/viewing this post.
please consult your financial advisor before taking any action.
----Vinaykumar hirem

KFINTECH Bullish Signals on Daily TimeframeKFINTECH is displaying multiple bullish signals with healthy volume on the daily timeframe. It is currently consolidating and may experience a slight dip, which could offer a good accumulation opportunity.
Stop loss: Your strategy

KFINTECHAlmost 35%+ corrected from Top Line: 1641, There are good buildup showing in 1day chart frame from bottom line 1034...
Keep it on radar, it will surely blast in few weeks... Strong fundamental and Q3FY25 result was excellent..

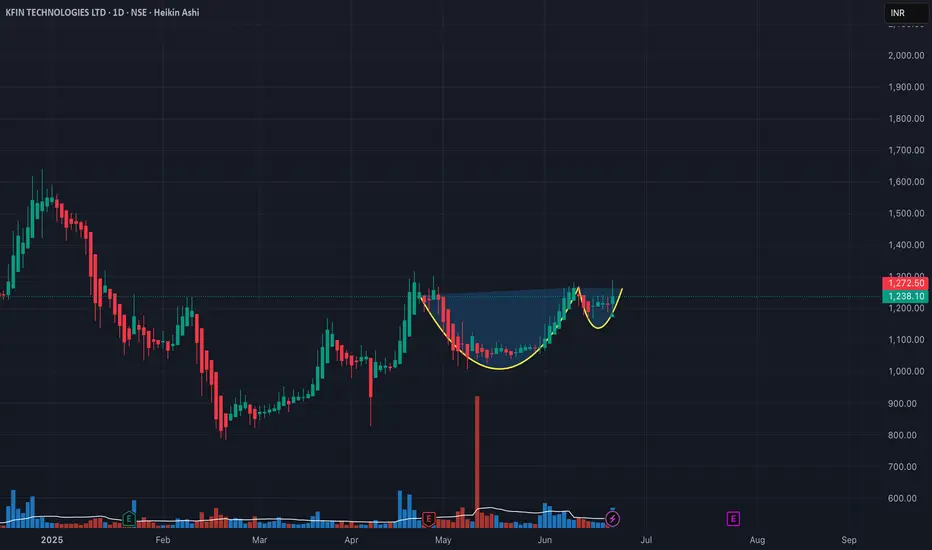
KfintechKfinTech, a super start stock, forming triangle patter and flying to unchartered zone. target are expected to 1200, 1300...

KFINTECHKFINTECH
Watch this stock very carefully at current price 1243, Ready for Target 1300, 1350 in few weeks..

KFIN Technologies Ltd view for Intraday 13th May #KFINTECH KFIN Technologies Ltd view for Intraday 13th May #KFINTECH
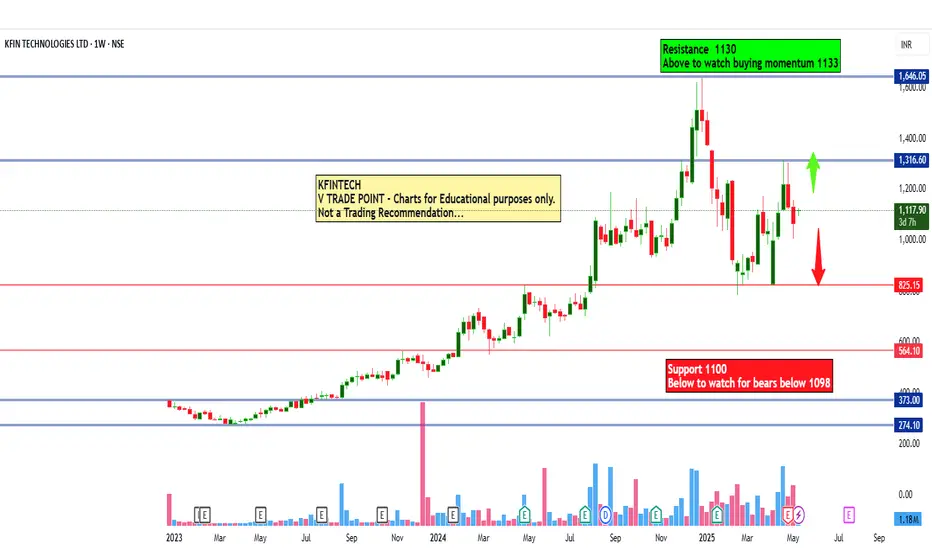
Resistance 1130 Watching above 1133 for upside movement...
Support area 1100 Below 1120 ignoring upside momentum for intraday
Watching below 1098 for downside movement...
Above 1120 ignoring downside move for intraday
Charts for Educat
KFin Technologies LtdCompany Snapshot:
Sector: Financial Services (Mutual Fund Services, RTA)
Market Cap: ₹21,000 Cr
Current Price: ₹1,239.20
Debt-to-Equity: 0.06 (very low)
ROE: 39% | ROCE: 49%
Financial Highlights:
Revenue Growth (3Y CAGR): ~22%
Profit Growth (3Y CAGR): ~32%
EBITDA Margin: ~48%
P/E Ratio: ~35x

See all ideas
Summarizing what the indicators are suggesting.
Neutral
SellBuy
Strong sellStrong buy
Strong sellSellNeutralBuyStrong buy
Neutral
SellBuy
Strong sellStrong buy
Strong sellSellNeutralBuyStrong buy
Neutral
SellBuy
Strong sellStrong buy
Strong sellSellNeutralBuyStrong buy
An aggregate view of professional's ratings.
Neutral
SellBuy
Strong sellStrong buy
Strong sellSellNeutralBuyStrong buy
Neutral
SellBuy
Strong sellStrong buy
Strong sellSellNeutralBuyStrong buy
Neutral
SellBuy
Strong sellStrong buy
Strong sellSellNeutralBuyStrong buy
Displays a symbol's price movements over previous years to identify recurring trends.
Frequently Asked Questions
The current price of KFINTECH is 1,164.60 INR — it has decreased by −5.52% in the past 24 hours. Watch KFIN TECHNOLOGIES LTD stock price performance more closely on the chart.
Depending on the exchange, the stock ticker may vary. For instance, on NSE exchange KFIN TECHNOLOGIES LTD stocks are traded under the ticker KFINTECH.
KFINTECH stock has fallen by −8.58% compared to the previous week, the month change is a −13.68% fall, over the last year KFIN TECHNOLOGIES LTD has showed a 58.16% increase.
We've gathered analysts' opinions on KFIN TECHNOLOGIES LTD future price: according to them, KFINTECH price has a max estimate of 1,600.00 INR and a min estimate of 1,090.00 INR. Watch KFINTECH chart and read a more detailed KFIN TECHNOLOGIES LTD stock forecast: see what analysts think of KFIN TECHNOLOGIES LTD and suggest that you do with its stocks.
KFINTECH reached its all-time high on Dec 30, 2024 with the price of 1,641.35 INR, and its all-time low was 272.00 INR and was reached on Mar 20, 2023. View more price dynamics on KFINTECH chart.
See other stocks reaching their highest and lowest prices.
See other stocks reaching their highest and lowest prices.
KFINTECH stock is 8.22% volatile and has beta coefficient of 1.49. Track KFIN TECHNOLOGIES LTD stock price on the chart and check out the list of the most volatile stocks — is KFIN TECHNOLOGIES LTD there?
Today KFIN TECHNOLOGIES LTD has the market capitalization of 200.49 B, it has decreased by −0.77% over the last week.
Yes, you can track KFIN TECHNOLOGIES LTD financials in yearly and quarterly reports right on TradingView.
KFIN TECHNOLOGIES LTD is going to release the next earnings report on Oct 17, 2025. Keep track of upcoming events with our Earnings Calendar.
KFIN TECHNOLOGIES LTD revenue for the last quarter amounts to 2.74 B INR, despite the estimated figure of 2.82 B INR. In the next quarter, revenue is expected to reach 3.33 B INR.
KFINTECH net income for the last quarter is 772.57 M INR, while the quarter before that showed 850.53 M INR of net income which accounts for −9.17% change. Track more KFIN TECHNOLOGIES LTD financial stats to get the full picture.
Yes, KFINTECH dividends are paid annually. The last dividend per share was 5.75 INR. As of today, Dividend Yield (TTM)% is 0.49%. Tracking KFIN TECHNOLOGIES LTD dividends might help you take more informed decisions.
KFIN TECHNOLOGIES LTD dividend yield was 0.73% in 2024, and payout ratio reached 38.68%. The year before the numbers were 0.94% and 39.77% correspondingly. See high-dividend stocks and find more opportunities for your portfolio.
EBITDA measures a company's operating performance, its growth signifies an improvement in the efficiency of a company. KFIN TECHNOLOGIES LTD EBITDA is 5.28 B INR, and current EBITDA margin is 45.37%. See more stats in KFIN TECHNOLOGIES LTD financial statements.
Like other stocks, KFINTECH shares are traded on stock exchanges, e.g. Nasdaq, Nyse, Euronext, and the easiest way to buy them is through an online stock broker. To do this, you need to open an account and follow a broker's procedures, then start trading. You can trade KFIN TECHNOLOGIES LTD stock right from TradingView charts — choose your broker and connect to your account.
Investing in stocks requires a comprehensive research: you should carefully study all the available data, e.g. company's financials, related news, and its technical analysis. So KFIN TECHNOLOGIES LTD technincal analysis shows the sell today, and its 1 week rating is buy. Since market conditions are prone to changes, it's worth looking a bit further into the future — according to the 1 month rating KFIN TECHNOLOGIES LTD stock shows the buy signal. See more of KFIN TECHNOLOGIES LTD technicals for a more comprehensive analysis.
If you're still not sure, try looking for inspiration in our curated watchlists.
If you're still not sure, try looking for inspiration in our curated watchlists.