KFINTECHKfintech the giant is looking handsome hulk on weekly chart, Keep on radar, above 1190 ready for 1250, 1300, 1350, 1400, 1500 in few Months.
KFINTECH trade ideas

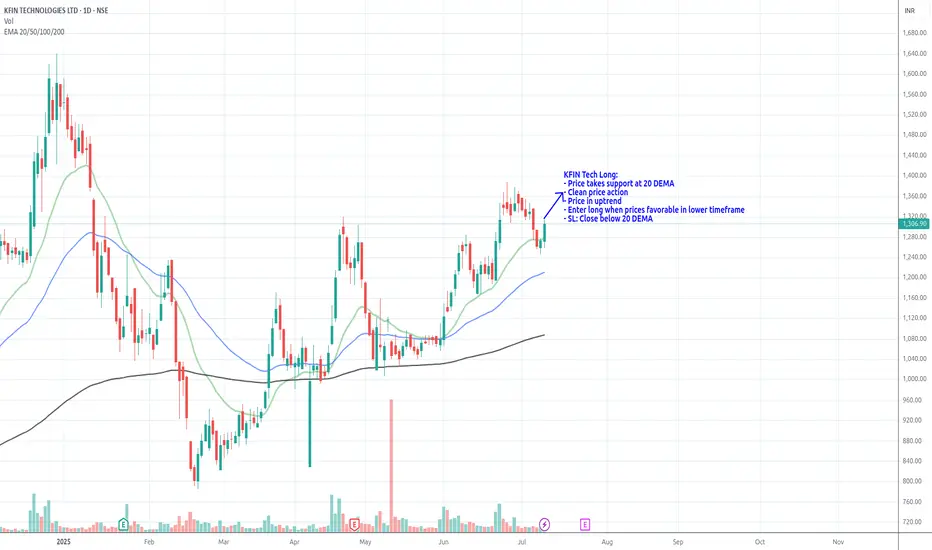
KFIN Tech_Long_Support @ 20DEMAKFIN Tech Long:
- Price takes support at 20 DEMA
- Clean price action
- Price in uptrend
- Enter long when prices favorable in lower timeframe
- SL: Close below 20 DEMA
Review and plan for 10th July 2025 Nifty future and banknifty future analysis and intraday plan.
Swing ideas.
This video is for information/education purpose only. you are 100% responsible for any actions you take by reading/viewing this post.
please consult your financial advisor before taking any action.
----Vinaykumar hiremath, CMT

KFINTECH Bullish Signals on Daily TimeframeKFINTECH is displaying multiple bullish signals with healthy volume on the daily timeframe. It is currently consolidating and may experience a slight dip, which could offer a good accumulation opportunity.
Stop loss: Your strategy

KFINTECHAlmost 35%+ corrected from Top Line: 1641, There are good buildup showing in 1day chart frame from bottom line 1034...
Keep it on radar, it will surely blast in few weeks... Strong fundamental and Q3FY25 result was excellent..

KfintechKfinTech, a super start stock, forming triangle patter and flying to unchartered zone. target are expected to 1200, 1300...

KFINTECHKFINTECH
Watch this stock very carefully at current price 1243, Ready for Target 1300, 1350 in few weeks..

KFIN Technologies Ltd view for Intraday 13th May #KFINTECH KFIN Technologies Ltd view for Intraday 13th May #KFINTECH
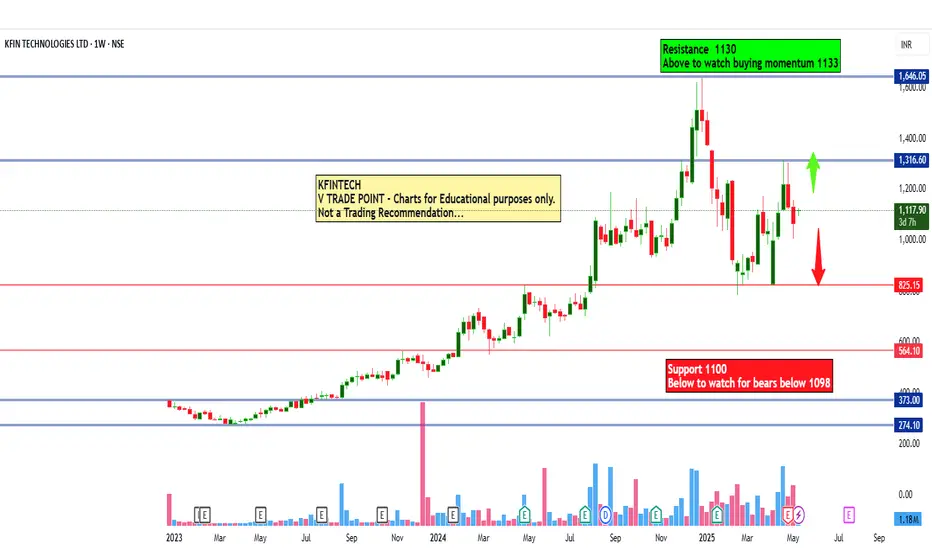
Resistance 1130 Watching above 1133 for upside movement...
Support area 1100 Below 1120 ignoring upside momentum for intraday
Watching below 1098 for downside movement...
Above 1120 ignoring downside move for intraday
Charts for Educational purposes only.
Please follow strict stop loss and risk reward if you follow the level.
Thanks,
V Trade Point
KFin Technologies LtdCompany Snapshot:
Sector: Financial Services (Mutual Fund Services, RTA)
Market Cap: ₹21,000 Cr
Current Price: ₹1,239.20
Debt-to-Equity: 0.06 (very low)
ROE: 39% | ROCE: 49%
Financial Highlights:
Revenue Growth (3Y CAGR): ~22%
Profit Growth (3Y CAGR): ~32%
EBITDA Margin: ~48%
P/E Ratio: ~35x (TTM)
Industry Avg P/E: ~30-32x
Recent Price Action:
Stock broke out sharply in April 2025.
Support: ₹1,180 | Resistance: ₹1,300
RSI near 70 (mildly overbought, but momentum strong).
Key Strengths:
Dominant RTA player with 70%+ MF asset share.
Consistent cash flows and expanding international footprint.
High operating leverage driving margin expansion.
Key Risks:
Regulatory changes (SEBI reforms) could pressure fees.
High client concentration risk with top AMCs.
Valuation & Recommendation:
DCF Estimated Fair Value: ₹1,280–₹1,350
Recommendation: BUY on Dips / Accumulate
12-month Target Price: ₹1,320
Investment Horizon: 1–2 years
📈 Verdict: Strong business fundamentals, steady growth, and low debt make KFin Technologies attractive for long-term investors. Minor corrections can offer better entry points.
For Education Purposes only

KFINTECHNOLOGYKFINTECH Is looking good to buy around 1000 after reversal confirmation, so lets watch and observe and keep it on radar

KFINTECH CMP 1050. (Positional)In this correction stock was corrected around 50%. Now chart showing strenth in price.For long term players it is a good opportunity.Add to your wachlist and see how it perform in coming days.Always keep stoploss.

PRE-ANALYSIS FOR KFIN TECHNOLOGIES (KFINTECH)Pre-Analysis for NSE:KFINTECH Technologies (KFintech)
🟢Key Observations
🟨 Yellow Consolidation Zone:
The highlighted yellow area (₹932–₹1,139 approx.) marks the consolidation phase.
This phase suggests the stock may remain range-bound in the short term, often signaling accumulation or preparation for a breakout.
📈 Current Price Action:
The stock's current price of ₹1,251.85 is slightly above the consolidation zone, indicating a possible upward movement if this level holds.
🎯 Long-Term Target:
The chart highlights a price target of ₹1,966 by November 2025, provided the stock sustains above the yellow zone.
The expected timeframe for this target is 6–9 months.
🔍 Entry Strategy:
The analysis suggests waiting for trade confirmation before entering. This implies looking for a breakout or strong bullish signals within or above the consolidation range.
📊 Volume:
A trading volume of 1.06M is noted, but its specific relevance to the setup isn't immediately clear from the chart.
Trading Insights
🚀 Bullish Outlook:
If the stock sustains above the consolidation zone, it could continue its upward move toward the mentioned target.
Previous price action supports this outlook, as the stock rallied before entering the consolidation phase.
⚠️ Risk Management:
A break below ₹932 could invalidate the bullish outlook and might lead to further downside movement.
✅ Confirmation Needed:
Wait for breakout signals such as rising volume 📈 or strong bullish candlesticks above ₹1,139 for a safer entry point.
🔴Disclaimer Update↘️
I am not a SEBI-registered advisor
Investments and securities are subject to market risk. Please carefully assess your risk tolerance before making any decisions. This analysis is for educational purposes only. Always consult a professional financial advisor for personalized advice. Trade responsibly and at your own risk.
If you really find this helpful than like,share,subscribe@alpha_strike_trader

KFIN TECHNOLOGIES LTD S/RSupport and Resistance Levels:
Support Levels: These are price points (green line/shade) where a downward trend may be halted due to a concentration of buying interest. Imagine them as a safety net where buyers step in, preventing further decline.
Resistance Levels: Conversely, resistance levels (red line/shade) are where upward trends might stall due to increased selling interest. They act like a ceiling where sellers come in to push prices down.
Breakouts:
Bullish Breakout: When the price moves above resistance, it often indicates strong buying interest and the potential for a continued uptrend. Traders may view this as a signal to buy or hold.
Bearish Breakout: When the price falls below support, it can signal strong selling interest and the potential for a continued downtrend. Traders might see this as a cue to sell or avoid buying.
MA Ribbon (EMA 20, EMA 50, EMA 100, EMA 200) :
Above EMA: If the stock price is above the EMA, it suggests a potential uptrend or bullish momentum.
Below EMA: If the stock price is below the EMA, it indicates a potential downtrend or bearish momentum.
Trendline: A trendline is a straight line drawn on a chart to represent the general direction of a data point set.
Uptrend Line: Drawn by connecting the lows in an upward trend. Indicates that the price is moving higher over time. Acts as a support level, where prices tend to bounce upward.
Downtrend Line: Drawn by connecting the highs in a downward trend. Indicates that the price is moving lower over time. It acts as a resistance level, where prices tend to drop.
Disclaimer:
I am not a SEBI registered. The information provided here is for learning purposes only and should not be interpreted as financial advice. Consider the broader market context and consult with a qualified financial advisor before making investment decisions.

Kfin Technologies Ltd: Performance Overview and Future OutlookStop loss mentioned on Chart
Kfin Technologies Ltd: Performance Overview and Future Outlook
Recent Stock Performance:
- Stock Surge: Kfin Technologies' stock soared 14% on Friday, reaching a 52-week high of ₹1033.8.
- Recent Trends: Over the last 5 sessions, the stock has risen more than 20%, and it has gained over 45% in the past 12 months.
Trading Activity:
- Volume and Value: On NSE, the stock's trading volume surged to 37.11 lakh shares, with a trade value of ₹372.09 crore, indicating strong investor interest.
Q1FY25 Earnings Report Highlights:
- Revenue: ₹238 crore, up 30.9% YoY.
- Profit After Tax (PAT): ₹68 crore, up 58% YoY.
- EBITDA: ₹100 crore, up 43% YoY, with an EBITDA margin of 42%.
- International Revenue: Surge of 56.6% YoY.
- VAS Revenue: Increase of 49.6% YoY.
Business Development:
- New Contracts: Significant growth in new contract sign-ups, especially in global fund services, alternatives and wealth solutions, fund administration, and technology solutions.
- Market Position: Kfin Technologies is a unique player in India, offering comprehensive services to asset managers, including mutual funds, alternative investment funds, and pension schemes. It is also one of the three central record-keeping agencies for the National Pension System (NPS).
Impact of Union Budget 2024:
- Increased Participation: The budget's push for higher participation in new pension schemes is likely to benefit Kfin Technologies, potentially increasing its business in pension and retirement solutions.
Future Outlook:
- Growth Prospects: The strong financial performance, coupled with increased demand for pension and fund administration solutions, positions Kfin Technologies well for continued growth.
- Investor Sentiment: Positive earnings and strategic positioning in a growing market contribute to the strong buying interest in the stock.
Investment Consideration:
- Strong Performance: Kfin Technologies shows robust financial health and growth prospects.
- Market Position: The company’s unique position in the market and the favorable budgetary environment suggest potential for sustained growth.
Disclaimer: For tailored investment advice, please consult with a qualified financial advisor.

Time to Halt the Rally after a sharp V-Shape RecoveryHere we can witness a sharp recovery on Kfin tech Chart where a lower level is at Rs 272 and now it's back again at his lifetime high level ie. Rs 373. it looks like KFIN Tech will face some resistance at that level.
Buy above if sustain above Rs 373 with a target of Rs 400 at least.
Note - Please consult your advisor for more decision-making.

KFIN Tech Trade SetupKFin Tech , an ipo has been trading along this beautiful trendline and taking support from it.

KFINTECHClosing Above 745 will result in good returns
Morgan Stanley recently brought this Stock
IT sector is started showing strength
Waiting for volumes and closing above 745
Stock showing good support at current level


KFINTECH BULLISHInitial public offer was at 366. 366 resistance can now act as support. there's a BO & small retest... buy at cmp or gtt order at 366 for targets 425 & 520.
SL 328 (if you want)


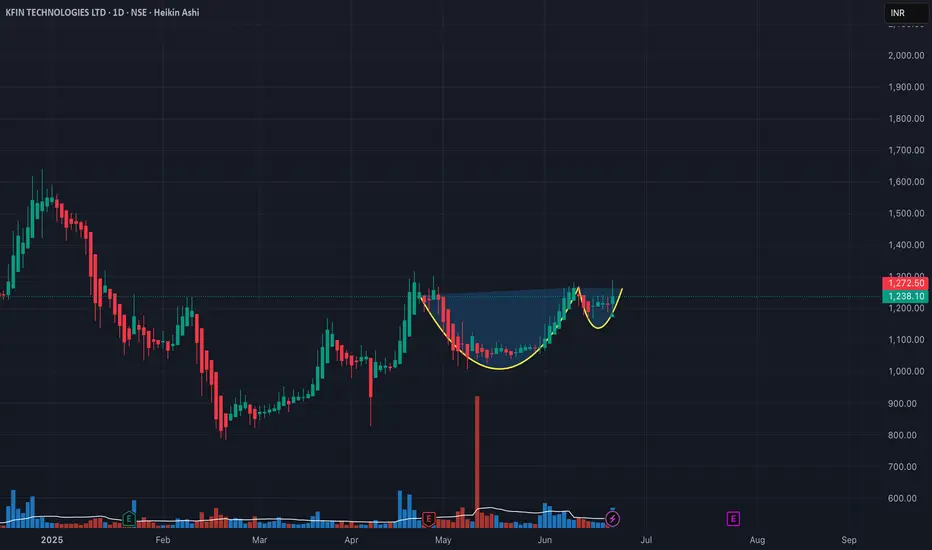
cup and handlestock is bullish above break out point of previous high , also cup and handle formation seen on daily chart once it breaks out of resistance zone.
