Next report date
—
Report period
—
EPS estimate
—
Revenue estimate
—
58.45 INR
4.87 B INR
24.61 B INR
37.37 M
About DR. LAL PATH LABS LTD.
Sector
Industry
CEO
Shankha Banerjee
Website
Headquarters
Gurgaon
Founded
1949
ISIN
INE600L01024
FIGI
BBG009WQGFD2
Dr. Lal PathLabs Ltd. engages in the business of running laboratories for carrying out pathological investigations. It also involves in providing diagnostic and healthcare tests and services. The company was founded by S. K. Lal in 1949 and is headquartered in Gurgaon, India.
Related stocks
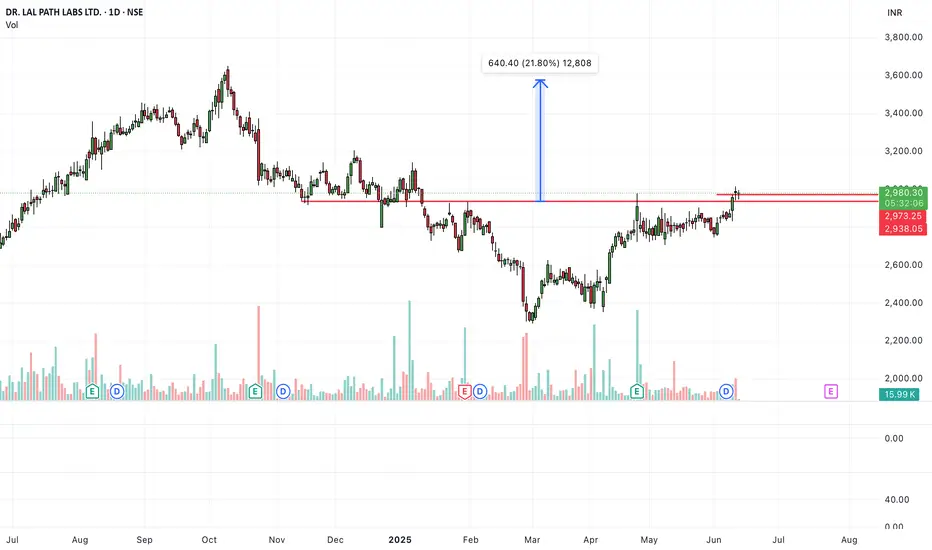
Dr Lal Path Labs - LongNSE:LALPATHLAB Weekly cycle trade setup with macd crossover and buyers at locations.

LALPATH LAB - LONGNSE:LALPATHLAB Weekly positive chart setups and price will be break above 2750 closing zone.
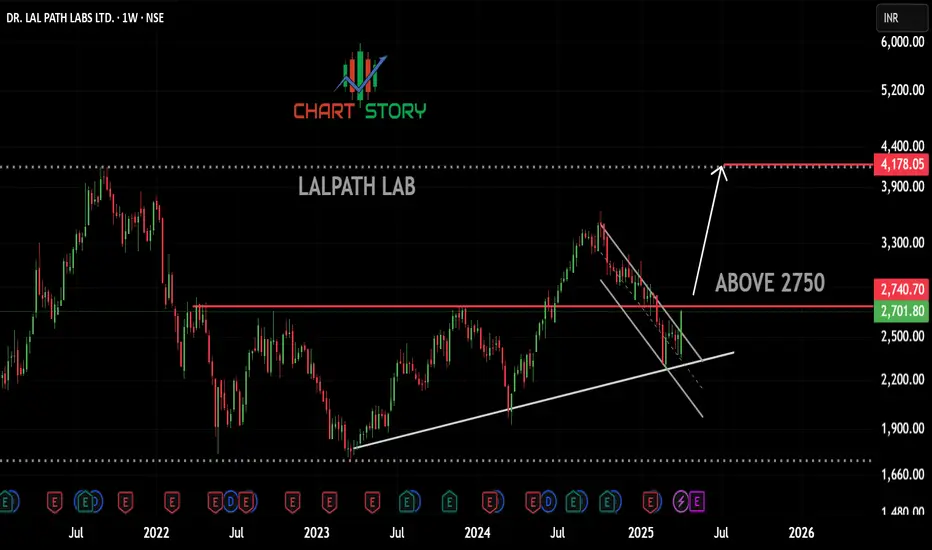
LALPATHLAB ready to Blast !!This is Weekly chart of LALPATHLAB
Stock is currently around law of Polarity
Stock has given no return from 2021 and currently given breakout around 2700
Stock has pending targets of 4000-4100 in weeks to come
Thank You !!

DR.LAL Path LABDR. Lal Path Lab
Trendline Breakout With Good Volume
RSI Above 60
Price Close Above EMA
Buy :- 3208
SL :- 2985
Target :- 3309 / 3356 / 3505 / 3605

DR. LAL PATH LABS LTD S/RSupport and Resistance Levels:
Support Levels: These are price points (green line/shade) where a downward trend may be halted due to a concentration of buying interest. Imagine them as a safety net where buyers step in, preventing further decline.
Resistance Levels: Conversely, resistance levels (re

lalpathlab buy swing /pos
now at 3329 buy near 3285
avg at 3250
sl 3215 2-3%
tgt 4%8%12%16%
buy near means 10+or- consider boz buyers zone

Dr Lal Pathlab (weekly Chart)Dr Lal Pathlab (weekly Chart)
Cup & Handle Pattern
Support 2767
Expected Level 3625 / 4245
RSI above 60 Daily / Weekly / Monthly
Volume Growth
PARMA / IT / FMCG / AUTO will continue to perform

Dr. Lal Path Lab Strong Bullish Momentum, Eyeing ₹3600On the weekly chart, Dr. Lal Path Lab stock is exhibiting a strong bullish trend, with solid upward momentum pushing the stock higher. Based on multiple RSI indicators, the stock remains above 60, signaling continued strength in the trend and positive buying pressure.
Key Technical Insights:
The

LALPATHLAB bullish flag buy side lalpathlab formed bullish flag on buy side. expecting good target. let's see

See all ideas
Summarizing what the indicators are suggesting.
Neutral
SellBuy
Strong sellStrong buy
Strong sellSellNeutralBuyStrong buy
Neutral
SellBuy
Strong sellStrong buy
Strong sellSellNeutralBuyStrong buy
Neutral
SellBuy
Strong sellStrong buy
Strong sellSellNeutralBuyStrong buy
An aggregate view of professional's ratings.
Neutral
SellBuy
Strong sellStrong buy
Strong sellSellNeutralBuyStrong buy
Neutral
SellBuy
Strong sellStrong buy
Strong sellSellNeutralBuyStrong buy
Neutral
SellBuy
Strong sellStrong buy
Strong sellSellNeutralBuyStrong buy
Displays a symbol's price movements over previous years to identify recurring trends.
Frequently Asked Questions
The current price of LALPATHLAB is 3,077.10 INR — it has decreased by −0.50% in the past 24 hours. Watch DR. LAL PATH LABS LTD. stock price performance more closely on the chart.
Depending on the exchange, the stock ticker may vary. For instance, on NSE exchange DR. LAL PATH LABS LTD. stocks are traded under the ticker LALPATHLAB.
LALPATHLAB stock has risen by 4.10% compared to the previous week, the month change is a 11.69% rise, over the last year DR. LAL PATH LABS LTD. has showed a 1.62% increase.
We've gathered analysts' opinions on DR. LAL PATH LABS LTD. future price: according to them, LALPATHLAB price has a max estimate of 3,931.00 INR and a min estimate of 2,110.00 INR. Watch LALPATHLAB chart and read a more detailed DR. LAL PATH LABS LTD. stock forecast: see what analysts think of DR. LAL PATH LABS LTD. and suggest that you do with its stocks.
LALPATHLAB reached its all-time high on Sep 15, 2021 with the price of 4,245.50 INR, and its all-time low was 696.50 INR and was reached on Jan 20, 2016. View more price dynamics on LALPATHLAB chart.
See other stocks reaching their highest and lowest prices.
See other stocks reaching their highest and lowest prices.
LALPATHLAB stock is 2.88% volatile and has beta coefficient of 0.27. Track DR. LAL PATH LABS LTD. stock price on the chart and check out the list of the most volatile stocks — is DR. LAL PATH LABS LTD. there?
Today DR. LAL PATH LABS LTD. has the market capitalization of 256.88 B, it has increased by 1.88% over the last week.
Yes, you can track DR. LAL PATH LABS LTD. financials in yearly and quarterly reports right on TradingView.
DR. LAL PATH LABS LTD. is going to release the next earnings report on Jul 31, 2025. Keep track of upcoming events with our Earnings Calendar.
LALPATHLAB earnings for the last quarter are 13.80 INR per share, whereas the estimation was 11.95 INR resulting in a 15.46% surprise. The estimated earnings for the next quarter are 14.28 INR per share. See more details about DR. LAL PATH LABS LTD. earnings.
DR. LAL PATH LABS LTD. revenue for the last quarter amounts to 6.03 B INR, despite the estimated figure of 6.04 B INR. In the next quarter, revenue is expected to reach 6.71 B INR.
LALPATHLAB net income for the last quarter is 1.55 B INR, while the quarter before that showed 967.00 M INR of net income which accounts for 60.08% change. Track more DR. LAL PATH LABS LTD. financial stats to get the full picture.
DR. LAL PATH LABS LTD. dividend yield was 0.97% in 2024, and payout ratio reached 41.04%. The year before the numbers were 1.06% and 55.76% correspondingly. See high-dividend stocks and find more opportunities for your portfolio.
As of Jul 26, 2025, the company has 5.31 K employees. See our rating of the largest employees — is DR. LAL PATH LABS LTD. on this list?
EBITDA measures a company's operating performance, its growth signifies an improvement in the efficiency of a company. DR. LAL PATH LABS LTD. EBITDA is 6.96 B INR, and current EBITDA margin is 28.75%. See more stats in DR. LAL PATH LABS LTD. financial statements.
Like other stocks, LALPATHLAB shares are traded on stock exchanges, e.g. Nasdaq, Nyse, Euronext, and the easiest way to buy them is through an online stock broker. To do this, you need to open an account and follow a broker's procedures, then start trading. You can trade DR. LAL PATH LABS LTD. stock right from TradingView charts — choose your broker and connect to your account.
Investing in stocks requires a comprehensive research: you should carefully study all the available data, e.g. company's financials, related news, and its technical analysis. So DR. LAL PATH LABS LTD. technincal analysis shows the buy rating today, and its 1 week rating is strong buy. Since market conditions are prone to changes, it's worth looking a bit further into the future — according to the 1 month rating DR. LAL PATH LABS LTD. stock shows the strong buy signal. See more of DR. LAL PATH LABS LTD. technicals for a more comprehensive analysis.
If you're still not sure, try looking for inspiration in our curated watchlists.
If you're still not sure, try looking for inspiration in our curated watchlists.