LAURUS LABS LTD S/RSupport and Resistance Levels:
Support Levels: These are price points (green line/shade) where a downward trend may be halted due to a concentration of buying interest. Imagine them as a safety net where buyers step in, preventing further decline.
Resistance Levels: Conversely, resistance levels (red line/shade) are where upward trends might stall due to increased selling interest. They act like a ceiling where sellers come in to push prices down.
Breakouts:
Bullish Breakout: When the price moves above resistance, it often indicates strong buying interest and the potential for a continued uptrend. Traders may view this as a signal to buy or hold.
Bearish Breakout: When the price falls below support, it can signal strong selling interest and the potential for a continued downtrend. Traders might see this as a cue to sell or avoid buying.
MA Ribbon (EMA 20, EMA 50, EMA 100, EMA 200) :
Above EMA: If the stock price is above the EMA, it suggests a potential uptrend or bullish momentum.
Below EMA: If the stock price is below the EMA, it indicates a potential downtrend or bearish momentum.
Trendline: A trendline is a straight line drawn on a chart to represent the general direction of a data point set.
Uptrend Line: Drawn by connecting the lows in an upward trend. Indicates that the price is moving higher over time. Acts as a support level, where prices tend to bounce upward.
Downtrend Line: Drawn by connecting the highs in a downward trend. Indicates that the price is moving lower over time. It acts as a resistance level, where prices tend to drop.
Disclaimer:
I am not SEBI registered. The information provided here is for learning purposes only and should not be interpreted as financial advice. Consider the broader market context and consult with a qualified financial advisor before making investment decisions.
LAURUSLABS trade ideas

Positional Setup for Laurus LabsCMP: ₹667.35
Breakout Level: ₹657–660 (now turned support)
Support Zones: ₹657, ₹618
Resistance Levels (next targets): ₹705–710, ₹735
Indicators:
Supertrend: ✅ Bullish
TEMA 5-9-20: ✅ Trending up
Volume/Price Action: Strong bullish candle post consolidation
📈 Technical View (Positional)
Laurus Labs has broken out above ₹657 resistance with strong momentum, closing near day’s high.
The chart shows a previous consolidation box (highlighted) followed by trend continuation—classic breakout setup.
Positional structure is bullish, with price holding above key moving averages.
🚀 Positional Targets:
Target 1: ₹705
Target 2: ₹735
SL (Closing Basis): ₹638

Laurus Labs: Short-Term Momentum Setup! 🚀 Laurus Labs: Short-Term Momentum Setup! 🚀
📉 CMP: ₹624
🔒 Stop Loss: ₹604
🎯 Target: ₹660
🔍 Why Laurus Labs?
✅ Key Fibonacci Confluence: Price hovering around the crucial 62% retracement level.
✅ Derivatives Signal: Highest Call OI at ₹620—now acting as support.
✅ Momentum Watch: The stock is positioned to gain traction in the short term.
💡 Quick Strategy
📈 Short-Term Trade: Ideal for momentum traders looking for a clean risk-reward setup.
🔒 Strict SL: Maintain a disciplined stop loss at ₹604 to safeguard capital.
📉 Disclaimer: Not SEBI-registered. Please do your own research or consult a financial advisor before investing.
#LaurusLabs #MomentumStocks #ShortTermTrade #TechnicalAnalysis #SwingTrading #StockMarketIndia

LAURUS LABS_ALL TIME HIGHPrice breached all time high with big green candle
with decent volume.
When the hourly looks attractive, worth trying to go long with tight SL.
Disc: Educational Purpose only

Laurus Labs : In a buy trajectory,recovering quit well Laurus Labs : In a buy trajectory,recovering quit well after a consolidation from 660
It's in a Buy trajectory on a monthly time frame as well .
( Not a Buy / Sell Recommendation
Do your own due diligence ,Market is subject to risks, This is my own view and for learning only .)

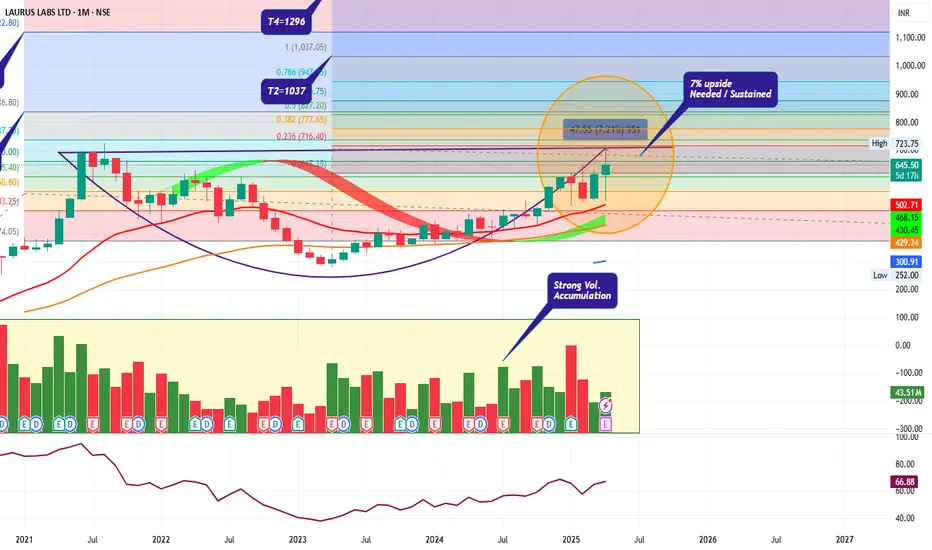
Laurus Labs Ltd.*Laurus Labs Ltd.*
P&F / RB on Yearly Basis
7% Upside required to complete the RB formation.
Should sustain, then only good to go!!!
Strong Vol. Accumulation / Continued Traction.
RSI: Needs to move in Bullish Zone
EMAs: Widening Gaps amongst 20 50 100 200 levels at Weekly / Monthly Basis.
*Trail SL with Upside*
*Book Profit as per Risk Appetite*
Improving Financials. Rising Revenue on Qtrly / Yrly basis. Strong TNW & Balance Sheet.
+ve CFO, Consistent WC Cycle.
Double Digit FII/DII Stake (Continued).
Concerns: Regulations
*This is an Opinion. Do your own research as well.*
*_Happy Investing_*🤓
LAURUSLABS Monthly Chart
Making Round bottom
Or Cup Pattern
Support 512
Entry 646
RSI above 60 D / W / M
(It's F&O Stock be careful)

Lauruslabs 15mins TFIn daily TF it looked weak. in 15 mins it gave a reversal from the 200ema.
i have shorted it with targets 590, 570
stoploss - 606 above close in 15mins or 5mins.
lets see how it goes

LAURUS LAB - LONGNSE:LAURUSLABS Weekly chart setup positive with momentum. Outperform the market in current scenario.

Laurus Lab CMP 583, 12.01.2025Laurus Labs at its resistance of 3 year back level, Good time to short for first target of 560 and second target of 520 which can be seen in next week.
If it breaks its resistance of 625 which is not easy, But if break good long position will initiate for target of 900 in 3-6 months

Amazing breakout on Weekly / Daily Timeframe - LAURUSLABSCheckout an amazing breakout happened in the stock in Weekly timeframe. Wait for weekly close above the breakout level.
Breakouts happening in longer timeframe is way more powerful than the breakouts seen in Daily timeframe. You can blindly invest once the weekly candle closes above the breakout line and stay invested forever. Also these stocks breakouts are lifelong predictions, it means technically these breakouts happen giving more returns in the longer runs. Hence, even when the scrip makes a loss of 10% / 20% / 30% / 50%, the stock will regain and turn around. Once they again enter the same breakout level, they will flyyyyyyyyyyyy like a ROCKET if held in the portfolio in the longer run.
Time makes money, GREEDY & EGO will not make money.
Also, magically these breakouts tend to prove that the companies turn around and fundamentally becoming strong. Also the magic happens when more diversification is done in various sectors under various scripts with equal money invested in each N500 scripts.
The real deal is when to purchase and where to purchase the stock. That is where Breakout study comes into play.
LET'S PUMP IN SOME MONEY AND REVOLUTIONIZE THE NATION'S ECONOMY!

Play for a Range Breakout...NSE:LAURUSLABS trade @ 445, Resistence is 485 & Support is 385. lauruslabs trade in range since APR/2023. You can watch for a breakout and next resistence is @ 600-625 after that its ATH @ 725.

Laurus Lab short @ 590.00 Rs Hello Frds ,
Laurus lab short from current price level @ 590.00 , Stoploss 625.00 Rs
bottom Target 430 - 450 RS zone
its Positional Trade.

Key Support / Resistance Breakout - Swing TradeDisclaimer: I am not a Sebi registered adviser.
This Idea is publish purely for educational purpose only before investing in any stocks please take advise from your financial adviser.
Key Support & Resistance Breakout. Stock has give Breakout of Resistance level. Keep in watch list. Buy above the high. Suitable for Swing Trade. Stop loss & Target Shown on Chart.
Be Discipline because discipline is the Key to Success in the STOCK Market.
Trade What you see not what you Think.

LAURUSLABS : Ready for 20% runLAURUSLABS
Bullish on Daily/Weekly/Monthly TF
Risk 4-5% Reward: 20%+
Targets are Estimated based on FIB Extensions
Best buy around 578

SWING IDEA - LAURUSLABSPrice Action seems to be forming Higher High and Higher Low Pattern.
Has broken the previous Lower Low Pattern with a big green candle .
434 is the major Support/Resistance Zone.
Currently price seems to be successfully breaking the 434 price.
Weekly close above this levels can take the stock to the next leg up.

LAURUS LABS ANALYSISStock can be added on breakout and retest of 450
Target of 630 and 730
If stock fails to give a breakout then it can be added at 390
Disclaimer : It's not a buy/sell recommendation. Posts/views are only for educational purpose.

LAURUS LABS | 125% returns | 4-year consolidation breakoutLAURUS LABS
Monthly time frame
Breakout from 4-year consolidation
Stock riding above 20- & 50- month moving averages
RSI > 50, signalling bullish momentum
MACD crossover done and is above the 0 line, signalling bullish momentum
Weekly time frame
Stock has broken out of the orange trend line resistance after retest
Stock has broken out of descending triangle pattern
Stock converging near 20-, 50- & 200-week moving averages
Golden crossover approaching (50WMA cross 200DMA)
RSI > 50, signalling bullish momentum
MACD above the 0 line, signalling bullish momentum
Daily time frame
Stock has been in an uptrend (white dotted parallel channel) since May 2023
Stock in the process of making a higher low (Dow theory)
Stock converging near 20-, 50- & 200-day moving averages
RSI = 50, signalling bullish momentum
MACD is about to cross the 0 line, indicating momentum build up
Conclusion
Entry: 450
Stop Loss: 385
Target 1: 550
Target 2: 720
Target 3: 1000

LAURUS LABS-Likely Flag Pattern BreakoutLAURUS LABS:Trading above all its critical EMAs viz 20/50/100/200 and has formed a flag pattern,based on the pattern the logical targets would be 500 -TGT 1 520 -TGT2(For educational purpose only)

LAURUS LABS LTD S/RSupport and Resistance Levels:
Support Levels: These are price points (green line/shade) where a downward trend may be halted due to a concentration of buying interest. Imagine them as a safety net where buyers step in, preventing further decline.
Resistance Levels: Conversely, resistance levels (red line/shade) are where upward trends might stall due to increased selling interest. They act like a ceiling where sellers come in to push prices down.
Breakouts:
Bullish Breakout: When the price moves above resistance, it often indicates strong buying interest and the potential for a continued uptrend. Traders may view this as a signal to buy or hold.
Bearish Breakout: When the price falls below support, it can signal strong selling interest and the potential for a continued downtrend. Traders might see this as a cue to sell or avoid buying.
20 EMA (Exponential Moving Average):
Above 20 EMA(50 EMA): If the stock price is above the 20 EMA, it suggests a potential uptrend or bullish momentum.
Below 20 EMA: If the stock price is below the 20 EMA, it indicates a potential downtrend or bearish momentum.
Trendline: A trendline is a straight line drawn on a chart to represent the general direction of a data point set.
Uptrend Line: Drawn by connecting the lows in an upward trend. Indicates that the price is moving higher over time. Acts as a support level, where prices tend to bounce upward.
Downtrend Line: Drawn by connecting the highs in a downward trend. Indicates that the price is moving lower over time. It acts as a resistance level, where prices tend to drop.
RSI: RSI readings greater than the 70 level are overbought territory, and RSI readings lower than the 30 level are considered oversold territory.
Combining RSI with Support and Resistance:
Support Level: This is a price level where a stock tends to find buying interest, preventing it from falling further. If RSI is showing an oversold condition (below 30) and the price is near or at a strong support level, it could be a good buy signal.
Resistance Level: This is a price level where a stock tends to find selling interest, preventing it from rising further. If RSI is showing an overbought condition (above 70) and the price is near or at a strong resistance level, it could be a signal to sell or short the asset.
Disclaimer:
I am not a SEBI registered. The information provided here is for learning purposes only and should not be interpreted as financial advice. Consider the broader market context and consult with a qualified financial advisor before making investment decisions.

Plan for 25th October 2024Nifty future and banknifty future analysis and intraday plan in kannada.
Result analysis.
This video is for information/education purpose only. you are 100% responsible for any actions you take by reading/viewing this post.
please consult your financial advisor before taking any action.
----Vinaykumar hiremath, CMT

Regression Channel for Predictive Price Analysis - LAURUSLABSUnderstanding the Regression Channel
A regression channel is a powerful tool in technical analysis, helping traders identify and predict price trends. It consists of a central regression line flanked by parallel lines, forming a channel that contains the majority of price movements.
Step-by-Step Guide to Drawing a Regression Channel
Identify the Trend: Start by identifying the trend you want to analyze. In this chart of Laurus Labs Ltd., we observe the trend from August 2023 to October 2024.
Draw the Regression Line: The central regression line represents the best-fit line through the price data, minimizing the distance between the line and data points. Use charting tools like TradingView to draw this line automatically.
Add Parallel Lines: Draw parallel lines above and below the regression line to form the channel. These lines should encompass most of the price data. The distance between the regression line and the parallel lines is typically determined by the standard deviation of the price data.
Using the Regression Channel for Predictive Analysis
Trend Identification: The upper boundary of the channel acts as a resistance level, while the lower boundary acts as a support level. Price movements within these boundaries are considered normal.
Reversal Signals: If the price breaks through the upper or lower boundary, it may signal a trend reversal. A breakout above the upper boundary suggests a bullish trend, while a break below the lower boundary indicates a bearish trend.
Entry and Exit Points: Traders can use the boundaries of the channel to determine entry and exit points. Buying near the lower boundary and selling near the upper boundary can be a profitable strategy.
Volume Analysis: Volume bars at the bottom of the chart show trading activity. Green bars indicate buying pressure, while red bars suggest selling pressure. Pay attention to volume spikes during price movements.
Conclusion
Drawing and analyzing a regression channel provides valuable insights into price movements. For Laurus Labs Ltd., the channel helps identify key levels where the price may stall or reverse, guiding your trading decisions. By understanding how to draw and interpret this channel, you can enhance your predictive analysis and improve your chances of success in the market.

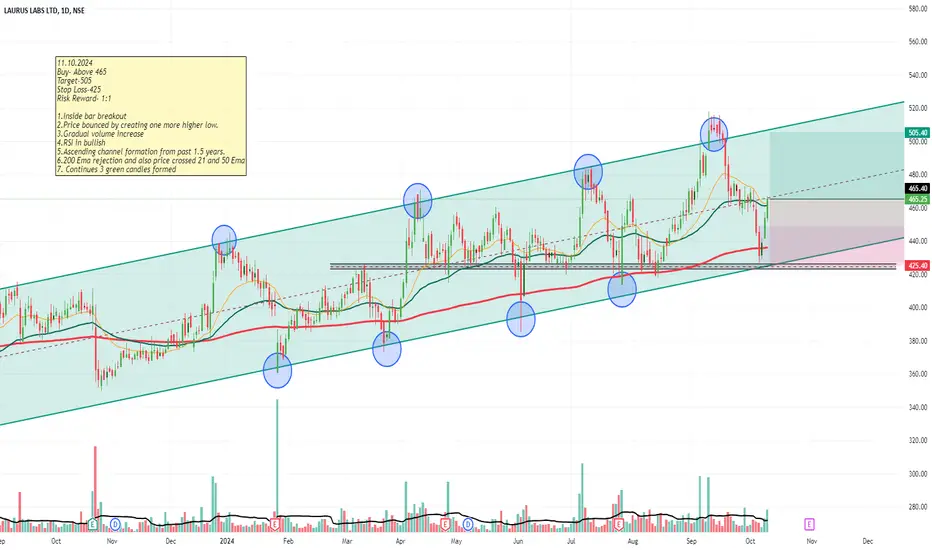
LaurusLab-Swing to Short term Bullish- Channel may continue!!
11.10.2024
Buy- Above 465
Target-505
Stop Loss-425
Risk Reward- 1:1
1.Inside bar breakout
2.Price bounced by creating one more higher low.
3.Gradual volume increase
4.RSI in bullish
5.Ascending channel formation from past 1.5 years.
6.200 Ema rejection and also price crossed 21 and 50 Ema
7. Continues 3 green candles formed NSE:LAURUSLABS