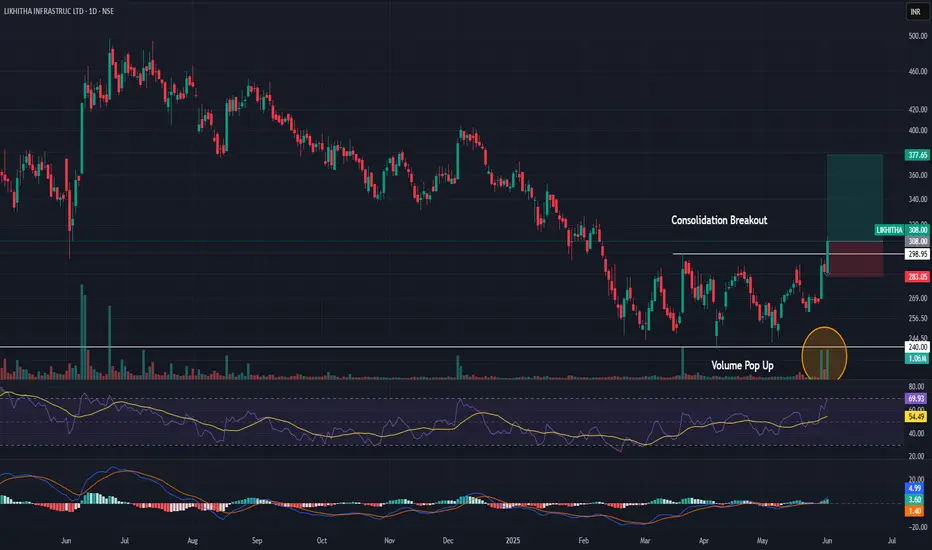
Momentum Trade in Likhitha Infra1. Positive Divergence on RSI
2. Good Volume
3. Consolidation Breakout
4. RSI near 70
5. MACD signal turning green
LIKHITHA trade ideas
LIKHITHA CMP 380.Likhitha Infra is Fundamentaly best company.Infra sector also in movement so we can consider it for a swing trade also Currently breaking out a trendline.If sustain above levels then we can see 420.........450 in coming days.Risk Reward is also 1:3. Add this to your wachlist and find your best entry exiit area.Thanks for support us.

Likitha Infra - Price SqueezeChart forming a bottom with price squeeze, with increasing sales, profit, dividend and fii accumulation, this looks to be attractive.

Likhita DailyLikhita Infrastructure LTD (Daily)
Cmp : 357
All time high breakout and retest
52 Week high breakout and retest
Huge Volume Spurt
Breakout with Volume
Can go long with previous swing low as SL
Disclaimer : No Buy Sell recommendation. For educational purpose only.

Breaking Resistance and Bullish Indication: LIKHITHAIntroduction:
In this blog post, we will be analyzing the stock price of LIKHITHA and its recent breakout above the resistance line. We will also be examining the bullish indication from the MACD on OBV.
LIKHITHA's Stock Price:
LIKHITHA's stock price has been trading in a range for the past few months, with support at around 272 and resistance at around 329. However, in recent times, the stock has broken above the resistance line and is currently trading at around 323. This breakout above the resistance line is a bullish sign and suggests that the stock may continue to rise.
Support and Resistance Lines:
Support and resistance lines are important technical analysis tools that traders use to identify potential areas of support and resistance in a stock's price. These lines are based on the stock's past price movements and are used to predict future price movements. In the case of LIKHITHA, the support line is at around 100 and the resistance line is at around 120.
MACD on OBV:
The MACD on OBV is a technical indicator that shows the relationship between the MACD and the on-balance volume (OBV). The MACD is a momentum indicator that is based on the difference between two moving averages. The OBV is a volume indicator that is based on the flow of money into and out of a stock. When the MACD is above the signal line and the OBV is positive, it is a bullish sign and suggests that the stock may continue to rise.
Conclusion:
In conclusion, LIKHITHA's breakout above the resistance line and the bullish indication from the MACD on OBV are both positive signs for the stock's future price movements. However, it is important to note that past performance is not indicative of future results and that investors should always do their own research and consult with a financial advisor before making any investment decisions.

Buy Likhitha InfrastructureSwing Trading Advice by Goodluck Capital
Buy Likhitha Infrastructure (NSE:LIKHITHA)
Buy Range- 275 - 280
Target- 300 - 305
StopLoss- below 260
Potential Return- 8-10%
Approx trade duration 10 - 12 days

Boom 🤯 super stock Entry CMP
Stop 296
Breakout trading implementation:
1. **Identifying New Trends:** Breakout trading helps traders identify the beginning of new trends by focusing on price levels where an asset breaks out of its historical trading range.
2. **Volatility Indicator:** Breakouts often occur when there's increased volatility in the market. Monitoring breakouts can provide insights into shifts in market sentiment and potential price movements.
3. **Entry Points:** Breakout points serve as potential entry points for traders looking to ride the momentum of a newly established trend. Buying on a breakout can capture the early stages of a price movement.
4. **Confirmation of Strength:** Successful breakouts indicate the strength of a trend. If an asset breaks out with high volume and follows through with sustained price movement, it suggests a strong trend in that direction.
5. **Avoiding False Signals:** Breakout strategies often include using indicators or confirmation signals to avoid false breakouts. This can enhance the accuracy of trade decisions.
6. **Defined Risk and Reward:** Breakout trading allows for setting clear stop-loss levels below the breakout point, which helps manage risk. Traders can also calculate potential profits based on the distance between the breakout point and a projected target.
7. **Adaptable to Various Markets:** Breakout trading can be applied to various markets, including stocks, forex, commodities, and cryptocurrencies. The concept remains consistent across different assets.
8. **Flexibility:** Traders can adapt breakout strategies to their preferred timeframes, whether they are day traders, swing traders, or long-term investors.
9. **Liquidity Opportunities:** Breakout points are often associated with increased trading volume, which can provide better liquidity for executing trades.
10. **Risk vs. Reward Assessment:** Traders can evaluate the potential risk of a trade (stop-loss) against the potential reward (target price), aiding in decision-making and portfolio management.
11. **Psychological Advantage:** Successful breakout trades can boost a trader's confidence and discipline, reinforcing the effectiveness of their strategy.
12. **Market Events:** Breakouts can occur around significant market events such as earnings reports, economic data releases, or geopolitical developments, offering traders opportunities to capitalize on sudden price movements.
Remember, while breakout trading offers potential advantages, it also carries risks. False breakouts and market reversals can lead to losses. Successful implementation requires a solid understanding of technical analysis, risk management, and the ability to adapt to changing market conditions.

Likhitha Infrastructure Ltd *Likhitha Infrastructure Ltd*
Rising C&H Formation on Yearly Basis.
Price BreakOut Needed. To be Watched.
Once Crossed 327 & Sustained, Then Good to Go!
Strong Vol. Consolidation & Continued BuiltUp.
Trail SL with Upside.
Book Profit as per Risk Appetite.
Do Your Own Research as well as. This is an Opinion

Swing Trade Stock 300 breakout stock price.
These are swing idea's which you can add your watchlist and analysis for yourself.
Keep on radar.
Potential upside stock!

Likhitha Infrastructure Ltd
- Brokeout from Ascending triangle pattern recently , retested the same area and ready for up move
- Targets mentioned in chart and stoploss is trendline of Ascending triangle or as per your risk apetite
Company is an oil & gas pipeline infrastructure service provider, focused on laying pipeline networks along with construction of associated facilities and providing operations & maintenance services to oil and gas companies in India.
Pipeline Infrastructure
City Gas Distribution
Operation and Maintenance Services
Future Outlook:
a) Company intends to expand into new verticals for Tankage Projects and expecting an order from IOCL
b) It is exploring opportunities in Middle East, Africa & other like countries, where there is a huge demand of Pipeline Infrastructure companies.
c) It is in talks with various Offshore T&I companies to foray in Offshore business
Market Cap
₹ 1,074 Cr.
Current Price
₹ 272
High / Low
₹ 316 / 118
Stock P/E
17.9
Book Value
₹ 63.4
Dividend Yield
0.46 %
ROCE
36.2 %
ROE
27.2 %
Face Value
₹ 5.00
Promoter holding
70.0 %
EPS last year
₹ 15.2
EPS latest quarter
₹ 4.12
Debt
₹ 0.00 Cr.
Pledged percentage
0.00 %
Net CF
₹ 17.7 Cr.
Price to Cash Flow
23.9
Free Cash Flow
₹ 35.9 Cr.
Debt to equity
0.00
OPM last year
22.0 %
OPM 5Year
21.6 %
Reserves
₹ 230 Cr.
Price to book value
4.29
Int Coverage
102
PEG Ratio
0.34

Long LikhithaLikhitha Infrastructure Limited
➡️VCP characteristics
➡️Key Moving averages sloping up
➡️Stock structure is Uptrend
➡️Breakout Level 265 Support 250
♻️Retweet for max reach

#LIKHITHA at 230.8 now. Good to move up now#LIKHITHA at 230.8 now. Broken out after results. Good results. Retested TRENDLINE support at 227 and now looks good to go for target 263 and PATTER TARGET 290

symmetrical triangle short term opportunity for upside trainglesymmetrical triangle short term opportunity for upside take trade after breakout from the trendline according to own risk this is not call just a analysis..


LIKHITHA looking good for long!!!Going long in Likhitha!
The following levels will be my targets and sl!
Once 8% roi is attained, will be using 200ema as tsl in the same tf!


Analysis and educatinalFalling wedge channel breakout and first resistance level breake after retracement nyc chart to analysing

LIKHITHA - BREAKOUT NEXT WEEK - LOAD ITLikhitha was in correction phase since last 1 year. Good Order book and Revenue Visibility. High Margin Business. CNG and Pipeline Infrastructure company

Potential Channel Breakout This one is looking to give a Channel breakout. Need to wait for the weekly close. Relative strength is negative but improving, which is a good sign.
Disc : Not a buy / sell recommendation. Study in detail from your end.


LikhithaThis is not a buying recommendation. Its only for my study purpose. Study well before you invest your hard earned money.


