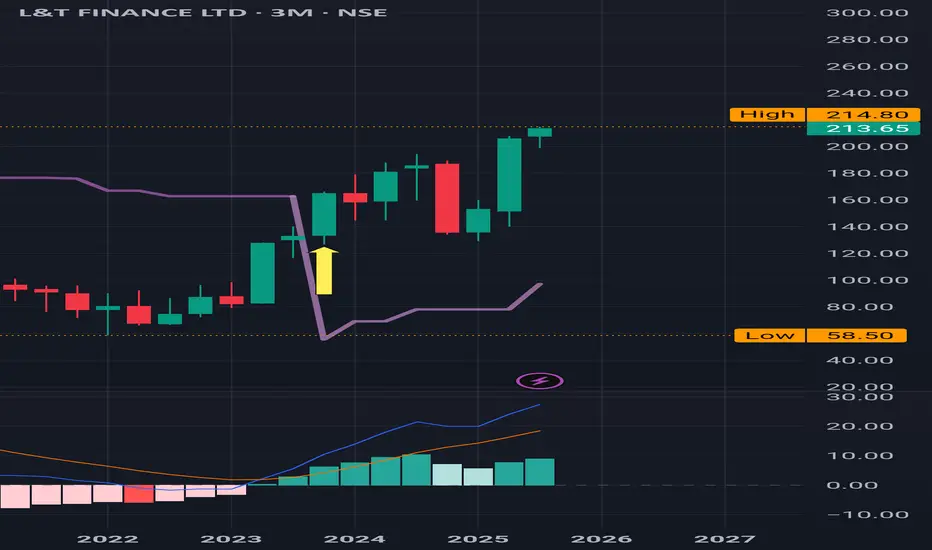
L&T Finance : Made a new High after a buy signal ,3 Months Time L&T Finance : Made a new High after a buy signal . Cleared the previous resistance of 198.90.
3 months Time Frame .
( Not a Buy / Sell Recommendation
Do your own due diligence ,Market is subject to risks, This is my own view and for learning only .)
Next report date
—
Report period
—
EPS estimate
—
Revenue estimate
—
10.66 INR
26.44 B INR
157.36 B INR
803.15 M
About L&T FINANCE LTD
Sector
Industry
CEO
Sudipta Roy
Website
Headquarters
Mumbai
Founded
2008
ISIN
INE498L01015
FIGI
BBG0016X7DF6
L&T Finance Ltd. is a non-banking financial company, which engages in the provision of financial products and services across retail, corporate, housing, and infrastructure finance sectors. It operates through the following segments: Rural Finance, Housing Finance, Infrastructure Finance, Defocused Business and Others. The Rural Finance segment comprises of farm equipment finance, two wheeler finance, and micro loans. The Housing Finance segment includes home loans, loan against property, and real estate finance. The Infrastructure Finance segment comprises of infrastructure business. The Defocused Business segment consists of structured corporate loans, debt capital market, commercial vehicle finance, construction equipment finance, SME term loans and leases. The Others segment deals in the asset and wealth management. The company was founded on May 1, 2008 and is headquartered in Mumbai, India.
Related stocks
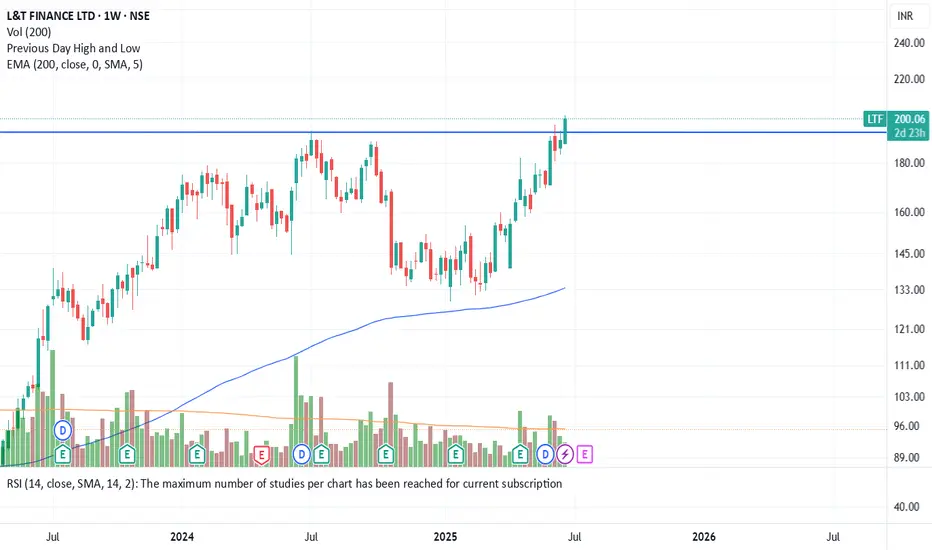
L&T Finance – Cup & Handle Breakout After 8 Years!L&T Finance has finally broken out of a classic Cup and Handle pattern, reclaiming its 2017 all-time high after nearly 8 years of consolidation. Strong volume confirmation adds weight to this long-term bullish breakout. A must-watch for positional traders and investors looking for momentum in the NB

L&T Finance : Monthly Time Frame , cleared the Red Band L&T Finance : Monthly Time Frame , cleared the Red Band Resistance at around 175 .
It's in a Buy trajectory on a daily time frame.
( Not a Buy / Sell Recommendation
Do your own due diligence ,Market is subject to risks, This is my own view and for learning only .)

[LTF] Long TermHi there,
LTF is looking good for long term only if monthly candle closes above the ATH. Breakout of Cup and Handle is a strong uptrend.
This is only for educational purpose, pls consult your financial advisor before investing.

LTF Price actionSO there is many change in character in the zone
firstly it moved upward and from the high of 196 the stock fell
it came near 180 to get some liquidity and then it it consolidated for a while
Then it gave a breakout, touched the level of 193 and later on again came to retest the level of 187.
Afte

HISTORIC BREAKOUT IN L&T FINANCE! The stock is trading at high levels at all times. Why is this a strong buy?
1. The Stock has given a breakout on a monthly as well as weekly chart.
2. When the stock breached the important levels, the volume was significantly high.
3. It has given a good close after the breakout and sustained the se
L&T FinancePrice near the key resistance.
High Probability bet
Enter Short when the Hourly chart looks favorable.

L&T Finance : Daily Time Frame , Buy L&T Finance : In a Buy trajectory on a daily time frame. Very clean buy signal and a flawless run after a Buy Signal
200 will be an important level to test as mentioned in my other post.
( Not a Buy / Sell Recommendation
Do your own due diligence ,Market is subject to risks, This is my own

L&T Finance : In a Buy trajectory on a Monthly time frame L&T Finance : In a Buy trajectory on a Monthly time frame .
Trying hard to stay above and clear major the Red Band resistance.
Rs. 200+ would be an important milestone.
( Not a Buy / Sell Recommendation
Do your own due diligence ,Market is subject to risks, This is my own view and for lear


See all ideas
Summarizing what the indicators are suggesting.
Neutral
SellBuy
Strong sellStrong buy
Strong sellSellNeutralBuyStrong buy
Neutral
SellBuy
Strong sellStrong buy
Strong sellSellNeutralBuyStrong buy
Neutral
SellBuy
Strong sellStrong buy
Strong sellSellNeutralBuyStrong buy
An aggregate view of professional's ratings.
Neutral
SellBuy
Strong sellStrong buy
Strong sellSellNeutralBuyStrong buy
Neutral
SellBuy
Strong sellStrong buy
Strong sellSellNeutralBuyStrong buy
Neutral
SellBuy
Strong sellStrong buy
Strong sellSellNeutralBuyStrong buy
Displays a symbol's price movements over previous years to identify recurring trends.
81LTF30
LTF-8.1%-28-6-30-PVTYield to maturity
8.14%
Maturity date
Jun 28, 2030
87LTF27
LTF-8.7%-15-4-27-NCDYield to maturity
7.35%
Maturity date
Apr 15, 2027
905LTF27
LTF-9.05%-15-4-27-NCDYield to maturity
6.73%
Maturity date
Apr 15, 2027
935LTF29
LTF-9.35%-13-3-29-NCDYield to maturity
6.62%
Maturity date
Mar 13, 2029
898LTF29
LTF-8.98%-13-3-29-NCDYield to maturity
6.44%
Maturity date
Mar 13, 2029
8LTF20
LTF-8.55%-28-01-2030-PVTYield to maturity
6.44%
Maturity date
Jan 28, 2030
85LTF26
LTF-8.50%-23-12-26-NCDYield to maturity
5.09%
Maturity date
Dec 23, 2026
865LTF26
LTF-8.65%-23-12-26-NCDYield to maturity
4.16%
Maturity date
Dec 23, 2026
885LTF27
LTF-8.85%-15-4-27-NCDYield to maturity
—
Maturity date
Apr 15, 2027
LTFPERP
LTFL-PERPETUAL-PVTYield to maturity
—
Maturity date
—
842LTF29
LTF-8.42%-24-9-29-PVTYield to maturity
—
Maturity date
Sep 24, 2029
See all LTF bonds
Frequently Asked Questions
The current price of LTF is 204.91 INR — it has decreased by −2.47% in the past 24 hours. Watch L&T FINANCE LTD stock price performance more closely on the chart.
Depending on the exchange, the stock ticker may vary. For instance, on NSE exchange L&T FINANCE LTD stocks are traded under the ticker LTF.
LTF stock has risen by 1.94% compared to the previous week, the month change is a 0.45% rise, over the last year L&T FINANCE LTD has showed a 17.76% increase.
We've gathered analysts' opinions on L&T FINANCE LTD future price: according to them, LTF price has a max estimate of 253.00 INR and a min estimate of 140.00 INR. Watch LTF chart and read a more detailed L&T FINANCE LTD stock forecast: see what analysts think of L&T FINANCE LTD and suggest that you do with its stocks.
LTF stock is 4.53% volatile and has beta coefficient of 1.84. Track L&T FINANCE LTD stock price on the chart and check out the list of the most volatile stocks — is L&T FINANCE LTD there?
Today L&T FINANCE LTD has the market capitalization of 511.66 B, it has decreased by −1.69% over the last week.
Yes, you can track L&T FINANCE LTD financials in yearly and quarterly reports right on TradingView.
L&T FINANCE LTD is going to release the next earnings report on Oct 17, 2025. Keep track of upcoming events with our Earnings Calendar.
LTF earnings for the last quarter are 2.81 INR per share, whereas the estimation was 2.68 INR resulting in a 4.53% surprise. The estimated earnings for the next quarter are 2.79 INR per share. See more details about L&T FINANCE LTD earnings.
L&T FINANCE LTD revenue for the last quarter amounts to 26.24 B INR, despite the estimated figure of 24.54 B INR. In the next quarter, revenue is expected to reach 26.77 B INR.
LTF net income for the last quarter is 7.01 B INR, while the quarter before that showed 6.36 B INR of net income which accounts for 10.21% change. Track more L&T FINANCE LTD financial stats to get the full picture.
Yes, LTF dividends are paid annually. The last dividend per share was 2.75 INR. As of today, Dividend Yield (TTM)% is 1.34%. Tracking L&T FINANCE LTD dividends might help you take more informed decisions.
L&T FINANCE LTD dividend yield was 1.80% in 2024, and payout ratio reached 25.93%. The year before the numbers were 1.58% and 26.77% correspondingly. See high-dividend stocks and find more opportunities for your portfolio.
As of Jul 28, 2025, the company has 36.52 K employees. See our rating of the largest employees — is L&T FINANCE LTD on this list?
EBITDA measures a company's operating performance, its growth signifies an improvement in the efficiency of a company. L&T FINANCE LTD EBITDA is 60.09 B INR, and current EBITDA margin is 76.89%. See more stats in L&T FINANCE LTD financial statements.
Like other stocks, LTF shares are traded on stock exchanges, e.g. Nasdaq, Nyse, Euronext, and the easiest way to buy them is through an online stock broker. To do this, you need to open an account and follow a broker's procedures, then start trading. You can trade L&T FINANCE LTD stock right from TradingView charts — choose your broker and connect to your account.
Investing in stocks requires a comprehensive research: you should carefully study all the available data, e.g. company's financials, related news, and its technical analysis. So L&T FINANCE LTD technincal analysis shows the neutral today, and its 1 week rating is buy. Since market conditions are prone to changes, it's worth looking a bit further into the future — according to the 1 month rating L&T FINANCE LTD stock shows the buy signal. See more of L&T FINANCE LTD technicals for a more comprehensive analysis.
If you're still not sure, try looking for inspiration in our curated watchlists.
If you're still not sure, try looking for inspiration in our curated watchlists.