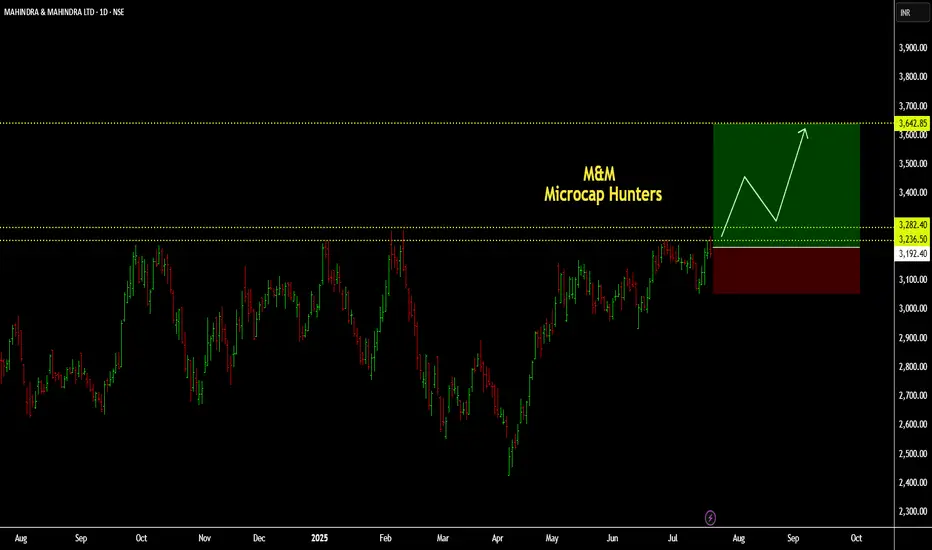
M&M (Breakout/Swing):M&M (Breakout/Swing):
M&M is getting ready to pass through the last 1 year's supply zone.
Signs of significant base formation is evident.
Trade offers a RR of more than 1:3.
Check out my earlier views for a better understanding.
Note: Do your own due diligence before taking any action.
Next report date
—
Report period
—
EPS estimate
—
Revenue estimate
—
115.90 INR
129.29 B INR
1.57 T INR
947.26 M
About MAHINDRA & MAHINDRA LTD
Sector
Industry
CEO
Anish Dilip Shah
Website
Headquarters
Mumbai
Founded
1945
ISIN
INE101A01026
FIGI
BBG000BKW818
Mahindra & Mahindra Ltd. is a holding company, which engages in the manufacturing of automotive vehicles. It operates through the following segments: Automotive, Farm Equipment, Auto Investment, Farm Investments, and Industrial Businesses and Consumer Services’ segment. The Automotive segment comprises of the sale of automobiles, spare parts, and related services. The Farm Equipment segment involves in the sale of tractors and spare parts. The Auto Investment segment pertains with investments in automotive related subsidiaries, associates and joint ventures. The Farm Investments segment refers to the investments in farm equipment related subsidiaries, associates and joint ventures. The Industrial Businesses and Consumer Services’ segment deals with investments in other than automotive & farm related subsidiaries, associates and joint ventures. The Others segment includes agri, construction equipment, powerol, and spares business unit. The company was founded by Jagdish Chandra Mahindra, Kailash Chandra Mahindra, and Ghulam Mohammed on October 2, 1945, and is headquartered in Mumbai, India.
Related stocks
M&MStock price has not crossed 3200 level and sustained. As marked on the chart it has taken resistance around 3200 level 4 times. As of now stock price is trading above 30min, 1hr and 4hr 200 ema.
Seems like price is sustaining near 3150 to 3200 zone. This is just an observation of price behaviour and


M & MBuy @ cmp - 3220
Stoploss - 2933.60
Target - 3777.10
3494.90
3575.75
3685.45
Happy Trading.
Jail Hind

Mahindra & Mahindra : Sitting at a Red band resistance Mahindra & Mahindra : Sitting at a Red band resistance
( Not a Buy / Sell Recommendation
Do your own due diligence ,Market is subject to risks, This is my own view and for learning only .)

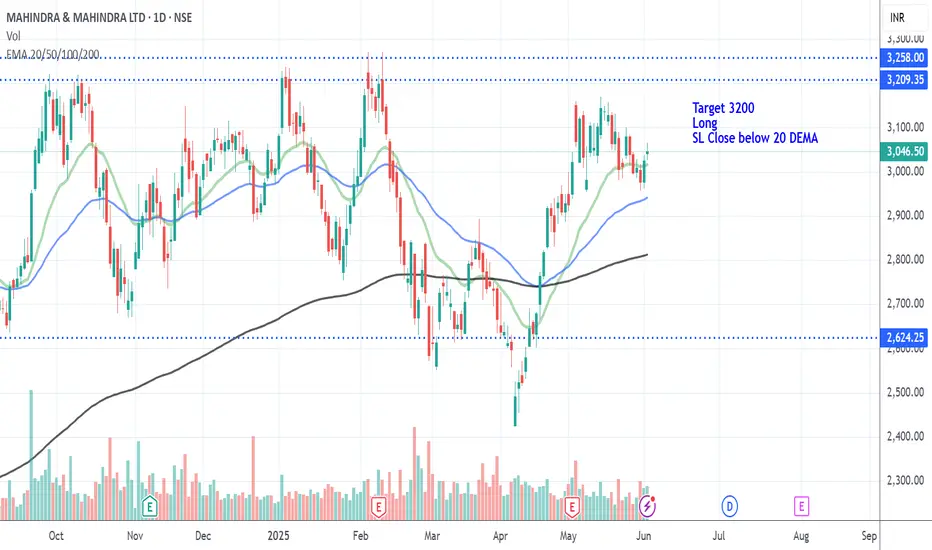
M&M LongM&M Long
Price Crossed above 20DEMA.
20 DEMA> 50 DEMA> 200 DEMA
Looks good for long with 3200 Target
SL- Close below 20 DEMA
Disc: Education Purpose only
M&M -Mahindra & Mahindra Ltd. (2 hours chart, NSE) - LongM&M -Mahindra & Mahindra Ltd. (2 hours chart, NSE) - Long Position; short-term research idea.
Risk assessment: Medium {volume structure integrity risk}
Risk/Reward ratio ~ 4.78
Current Market Price (CMP) ~ 2935
Entry limit ~2930 to 2910 (Avg. - 2920) on April 30, 2025
1. Target limit ~ 3015

M&Mi Observed these Levels based on Price Action and Demand & Supply which is my own Concept "PENDAM CONCEPTS"... Please don't take any trades based on this chart/post... Because this chart is for educational purpose only not for Buy or Sell Recommendation... Thank Q

Bearish View On Mahindra & Mahindra Mahindra & Mahindra Ltd is one of the most diversified automobile company in India with presence across 2-wheelers, 3-wheelers, PVs, CVs, tractors & earthmovers.
It also has presence across financial services, auto components, hospitality, infrastructure, retail, logistics, steel trading and proces

Levels to watch out Based on the intrinsic value analysis, Mahindra and Mahindra Ltd. (M&M) is currently overvalued. With an intrinsic value of 1,633 per share and a market price of 2,665, the stock is trading at a premium of about 39%. This suggests that M&M does not present an attractive investment opportunity at t

See all ideas
Summarizing what the indicators are suggesting.
Neutral
SellBuy
Strong sellStrong buy
Strong sellSellNeutralBuyStrong buy
Neutral
SellBuy
Strong sellStrong buy
Strong sellSellNeutralBuyStrong buy
Neutral
SellBuy
Strong sellStrong buy
Strong sellSellNeutralBuyStrong buy
An aggregate view of professional's ratings.
Neutral
SellBuy
Strong sellStrong buy
Strong sellSellNeutralBuyStrong buy
Neutral
SellBuy
Strong sellStrong buy
Strong sellSellNeutralBuyStrong buy
Neutral
SellBuy
Strong sellStrong buy
Strong sellSellNeutralBuyStrong buy
Displays a symbol's price movements over previous years to identify recurring trends.
955MML2063
955MML2063Yield to maturity
—
Maturity date
Jul 4, 2063
757MML26
MML-7.57%-25-9-26-PVTYield to maturity
—
Maturity date
Sep 25, 2026
See all M&M bonds
Frequently Asked Questions
The current price of M&M is 3,246.40 INR — it has decreased by −0.44% in the past 24 hours. Watch MAHINDRA & MAHINDRA LTD stock price performance more closely on the chart.
Depending on the exchange, the stock ticker may vary. For instance, on NSE exchange MAHINDRA & MAHINDRA LTD stocks are traded under the ticker M&M.
M&M stock has risen by 1.20% compared to the previous week, the month change is a 2.09% rise, over the last year MAHINDRA & MAHINDRA LTD has showed a 15.95% increase.
We've gathered analysts' opinions on MAHINDRA & MAHINDRA LTD future price: according to them, M&M price has a max estimate of 4,000.00 INR and a min estimate of 2,760.00 INR. Watch M&M chart and read a more detailed MAHINDRA & MAHINDRA LTD stock forecast: see what analysts think of MAHINDRA & MAHINDRA LTD and suggest that you do with its stocks.
M&M stock is 1.46% volatile and has beta coefficient of 1.70. Track MAHINDRA & MAHINDRA LTD stock price on the chart and check out the list of the most volatile stocks — is MAHINDRA & MAHINDRA LTD there?
Today MAHINDRA & MAHINDRA LTD has the market capitalization of 4.04 T, it has increased by 1.06% over the last week.
Yes, you can track MAHINDRA & MAHINDRA LTD financials in yearly and quarterly reports right on TradingView.
MAHINDRA & MAHINDRA LTD is going to release the next earnings report on Jul 31, 2025. Keep track of upcoming events with our Earnings Calendar.
M&M earnings for the last quarter are 20.30 INR per share, whereas the estimation was 21.71 INR resulting in a −6.51% surprise. The estimated earnings for the next quarter are 26.75 INR per share. See more details about MAHINDRA & MAHINDRA LTD earnings.
MAHINDRA & MAHINDRA LTD revenue for the last quarter amounts to 313.53 B INR, despite the estimated figure of 301.48 B INR. In the next quarter, revenue is expected to reach 339.87 B INR.
M&M net income for the last quarter is 32.95 B INR, while the quarter before that showed 31.81 B INR of net income which accounts for 3.60% change. Track more MAHINDRA & MAHINDRA LTD financial stats to get the full picture.
Yes, M&M dividends are paid annually. The last dividend per share was 25.30 INR. As of today, Dividend Yield (TTM)% is 0.65%. Tracking MAHINDRA & MAHINDRA LTD dividends might help you take more informed decisions.
MAHINDRA & MAHINDRA LTD dividend yield was 0.95% in 2024, and payout ratio reached 21.83%. The year before the numbers were 1.10% and 20.86% correspondingly. See high-dividend stocks and find more opportunities for your portfolio.
As of Jul 26, 2025, the company has 78.76 K employees. See our rating of the largest employees — is MAHINDRA & MAHINDRA LTD on this list?
EBITDA measures a company's operating performance, its growth signifies an improvement in the efficiency of a company. MAHINDRA & MAHINDRA LTD EBITDA is 302.96 B INR, and current EBITDA margin is 18.22%. See more stats in MAHINDRA & MAHINDRA LTD financial statements.
Like other stocks, M&M shares are traded on stock exchanges, e.g. Nasdaq, Nyse, Euronext, and the easiest way to buy them is through an online stock broker. To do this, you need to open an account and follow a broker's procedures, then start trading. You can trade MAHINDRA & MAHINDRA LTD stock right from TradingView charts — choose your broker and connect to your account.
Investing in stocks requires a comprehensive research: you should carefully study all the available data, e.g. company's financials, related news, and its technical analysis. So MAHINDRA & MAHINDRA LTD technincal analysis shows the buy rating today, and its 1 week rating is buy. Since market conditions are prone to changes, it's worth looking a bit further into the future — according to the 1 month rating MAHINDRA & MAHINDRA LTD stock shows the buy signal. See more of MAHINDRA & MAHINDRA LTD technicals for a more comprehensive analysis.
If you're still not sure, try looking for inspiration in our curated watchlists.
If you're still not sure, try looking for inspiration in our curated watchlists.