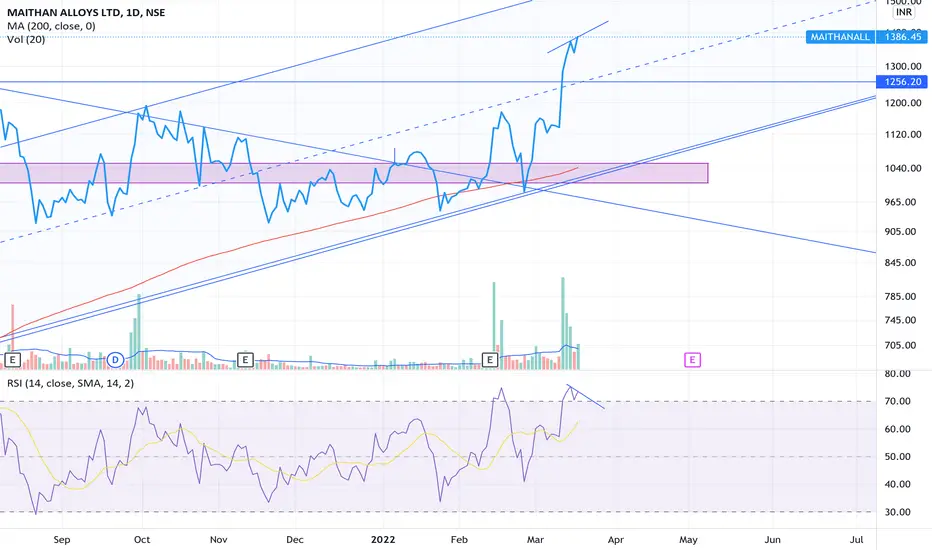
MAITHANLL - Simple Flag and Pole BreakoutWhen it comes to trading, i like to keep it simple.
Nothing fancy here, 50 DMA crossing over 200 DMA.
Trend line Breakout
Strong prior trend with good volumes, follow through happening today.
Keep 1120 as SL and trail
MAITHANALL trade ideas

MAITHANALL - A bullish flag structureMetals are going to soar once the volatility subsides. Structures are already visible in some names. These are going to be the leaders of tomorrow.

Maithan- the so called KUMBHAKARAN.#MaithanAlloys may have completed Wave 2 at ₹792.
Eyeing Wave 3 targets: ₹2,072 → ₹2,879 → ₹3,945 📈
Weekly breakout + volume ✅ | RSI strong
SL below ₹1050 | #ElliottWave #Fibonacci #BreakoutStocks

Maithan: Rally seems to be initiatedHere are possible targets for long term. My view is hold for at least a year.
Can reverse from target zones because these are previously resistance zones.

MAITHAN Alloys Breakout Setup➡️ Breakout near ₹1,239.90
➡️ Next resistance levels: ₹1,289.75 and ₹1,350.20
➡️ RSI: 65.65, showing strength but approaching overbought territory
➡️ Volume: Strong volume confirming the recent uptrend
➡️ Join trend: Watch for break of ₹1,239.90

Maithan Alloys ready to soar ... Keep in Radar keep SL 950 WCB .Avoid Noise and keep in watch list its Maithan Alloys .... Need to close above 1270 WCA with SL 955 WCB for target 1700+ . CMP 1200. Buy on Dips ... 1350 Stiff resistance if cross with huge volume it will be rocket....

Maithan Alloys bullish with low risk setupStock is trading in a limited range and here we are again ready for booking a handsome profit everything discussed in the chart where to book profit and what is the stop loss go with this setup this is a lowest set up best of luck

MAITHANALL - Maithan Alloys - Bullish Momentum (Strongly Buy)Technical Analysis of MAITHANALL:- As per previous chart history and current chart pattern is in, Maithan Alloys is in uptrend and showing Strong Bullish Momentum. Also this is trading in a Symmetrical Triangle
You can Buy this stock at above 1245.75 or wait for a dip to enter in the buy trade for this stock. This is my personal opinion and please do your own research because I am not SEBI registered person
Overall Positive Trend: - According to my analysis, the technical ratings for MAITHANALL are currently strong buy on a 1 week and 1 month timeframe
Relative Strength Index (RSI): - Indicates the stock may be neither overbought nor oversold
Important Disclaimer:
Technical analysis is not a perfect science and should not be the sole factor in your investment decisions. Consider fundamental analysis, market conditions, and your own risk tolerance before making any trades.
Thanks for your support as always

Maithan can make smart movesMaithan Alloys Ltd. manufactures and exports manganese alloys. Its products include Ferro silicon, Ferro manganese, and silicon manganese. The firm also generates and supplies wind power.
Maithan Alloys Ltd CMP is 1212.15. The positive aspects of the company are Company with Low Debt, Company with Zero Promoter Pledge, MFs increased their shareholding last quarter, Companies with 10% increase in share price over three months, with rising net profit growth and Companies with rising net profit margins. The Negative aspects of the company are Inefficient use of capital to generate profits, Degrowth in Revenue and Profit, Declining Net Cash Flow : Companies not able to generate net cash and Annual net profit declining.
Entry can be taken after closing above 1223. Targets in the stock will be 1267 and 1307. The long-term target in the stock will be 1351. Stop loss in the stock should be maintained at Closing below 1126.
The above information is provided for educational purpose, analysis and paper trading only. Please don't treat this as a buy or sell recommendation for the stock. We do not guarantee any success in highly volatile market or otherwise. Stock market investment is subject to market risks which include global and regional risks. We will not be responsible for any Profit or loss that may occur due to any financial decision taken based on any data provided in this message.

Maithan Alloys LtdTARGET GIVEN IN CHART
STOPLOSS = BOOKVALUE
FUNDAMENTALS
Market Cap
₹ 3,464 Cr.
Current Price
₹ 1,190
High / Low
₹ 1,336 / 766
Stock P/E
11.8
Book Value
₹ 999
Dividend Yield
0.51 %
ROCE
25.6 %
ROE
20.0 %
Face Value
₹ 10.0
Promoter holding
75.0 %
EPS last year
₹ 171
EPS latest quarter
₹ 21.3
Debt
₹ 13.7 Cr.
Pledged percentage
0.00 %
Net CF
₹ 1.13 Cr.
Price to Cash Flow
3.58
Free Cash Flow
₹ 962 Cr.
Debt to equity
0.00
OPM last year
20.4 %
OPM 5Year
22.3 %
Reserves
₹ 2,880 Cr.
Price to book value
1.17
Int Coverage
191
PEG Ratio
1.00
Price to Sales
1.68
Return on assets
17.4 %

MAITHANALL Alloys Ltd - Buying OpportunityAs per technical analysis and stock fundamental, I am in buy for this stock. All points are mentioned on the chart itself and as per my analysis, buying should be above 1182.20
I am not suggesting anyone to buy this stock, this is my personal opinion.
Do your own research before enytering into stock buying/selling.
Thanks for supporting as always

Maithan alloy A cup and handle is considered a bullish signal extending an uptrend, and it is used to spot opportunities to go long. Technical traders using this indicator should place a stop buy order slightly above the upper trendline of the handle part of the pattern.

Maithan Alloy: getting ready?the max it can consolidate is till nov 2023, thereafter it needs to take a move. may blast good, short term target can be 1200 minimum.

MAITHANALL: A Bullish Symmetric Triangle Pattern on the Cards?Introduction:
MAITHANALL, a stock listed on the National Stock Exchange (NSE), has been making waves in the market with its impressive price action. The stock has been trending upwards, with a clear support and resistance trend line drawn from the weekly timeframe. This trend line has been perfectly supported by the price, and it has formed a symmetric triangle pattern - a bullish sign that could indicate a potential breakout ahead.
Symmetric Triangle Pattern:
A symmetric triangle pattern is a bullish pattern that forms when the price action is confined within a narrow range, with a clear support and resistance trend line. The pattern is considered bullish because it indicates that the buyers and sellers are equally matched, and the stock is likely to break out of the range soon.
In the case of MAITHANALL, the stock has been trading within a well-defined range for the past few weeks, with a clear support and resistance trend line drawn from the weekly timeframe. The stock has been bouncing off the support trend line and testing the resistance trend line, indicating a strong likelihood of a breakout ahead.
Price Action:
The price action of MAITHANALL has been impressive, with the stock consistently making higher highs and higher lows. The stock has been trading above its 50-day and 200-day moving averages, which is a bullish sign. The relative strength index (RSI) is also above 50, indicating that the stock is in an overbought territory, but not yet at extreme levels.
The stock has also formed a series of higher highs and higher lows in the recent past, which is a clear sign of an uptrend. The stock has been trading above its moving averages, and the RSI is above 50, indicating that the uptrend is likely to continue.
Breakout Levels:
The breakout levels for MAITHANALL are around ₹1125. The stock has been trading around ₹1000 for the past few weeks, and a breakout above ₹1125 could be a strong indication of a bullish trend. A breakout above ₹1170 could be an even stronger indication of a potential uptrend.
Conclusion:
MAITHANALL is currently trading in a bullish symmetric triangle pattern, which is a strong indication of a potential breakout ahead. The stock has been consistently making higher highs and higher lows, and the RSI is above 50, indicating that the uptrend is likely to continue.
However, it is important to note that the stock market is inherently unpredictable, and there is always a risk of loss when trading or investing in the stock market. Therefore, it is important to do your own research and consult with a financial advisor before making any investment decisions.

Stage-2 Breakout/Double Bottom BreakuotMetal Stocks are in flavour since couple of weeks.Maithan Alloys looks good for a Swing Oppurtunity from here.Target and SL has been already mentioned on the Chart itself.

Bullish Move: MAITHANALLIntroduction:
In technical analysis, trendlines are one of the most popular tools used by traders to identify and trade within established market trends. A trendline is simply a line drawn on a chart to connect a series of highs or lows, and it can serve as both a support level and resistance level depending on how the trend is moving. When the weekly price range follows the trendline as support and signals bullish moves, it can be a powerful indication of a potential buying opportunity.
In this article, we will explore what this chart pattern means and how it can be used to improve your trading decisions.
What Does It Mean?
When the weekly price range follows the trendline as support and signals bullish moves, it means that the stock's price action is following a clear upward trend. The trendline acts as a guide for the stock's movement, providing a clear path for the price to move higher. Additionally, when the weekly price range follows the trendline as support, it means that the stock is likely to experience a bounce off of the trendline if the price falls too low. This bounce can provide a buying opportunity for traders who are looking to enter long positions.
How Can You Use This Chart Pattern?
To use this chart pattern effectively, you need to first identify a clear uptrend in the stock's price action. This can be done using various techniques such as identifying a series of higher highs and higher lows, or using a moving average convergence divergence (MACD). Once you have identified a clear uptrend, look for a trendline that connects several highs or lows along the same side of the trend. This trendline will act as your support level and signal a bullish move. Next, observe the weekly price range to see if it follows the trendline as support. If the price range consistently tests the trendline but fails to break through it, then you may consider entering a long position. This is because the trendline provides a clear path for the price to move higher, and the weekly price range following the trendline as support suggests that there is a strong likelihood of a bounce off of the trendline.
Conclusion:
The weekly price range following the trendline as support and signaling bullish moves is a powerful indicator of a potential buying opportunity. By understanding how to identify and use this chart pattern, you can improve your trading decisions and potentially increase your chances of success in the markets. Remember to always use multiple forms of confirmation and risk management strategies when trading, and never rely solely on a single indicator or chart pattern. Happy trading!

Maithan in a Mood to March Forward.
Maithan Alloys Ltd is among India’s leading manufacturers and exporters of niche value-added Manganese alloys. The company prime products include Ferro Manganese, Silicon Manganese and Ferro Silicon. It has a global presence with customers like SAIL, Tata Steel and Jindal Steel & Power. Maithan Alloys CMP is 1070.35.
The Negative aspects of the company is declining annual net profits. The Positive aspects of the company are improving cash from operations annual, no debt, FIIs are increasing stake and zero promoter pledge.
Entry after closing above 1077. Targets in the stock will be 1122 and 1170. Long term targets in the stock will be 1207 and 1271. Stop loss in the stock should be maintained at closing below 968.
(Disclaimer: I am a NISM certified Research Analyst but have not registered for SEBI authorization. The purpose of sharing the views is purely educational in nature for paper trading only. We will not be responsible for any profit or loss of any individual or institution which takes position based on our analysis.)

Resistance BreakoutPlease look into the chart for a detailed understanding.
Consider these for short-term & swing trades with 2% profit.
For BTST trades consider booking
target for 1% - 2%
For long-term trades look out for resistance drawn above closing.
Please consider these ideas for educational purpose

#MAITHANALL #COALINDIA #NMDC #GMDCLTD #NATIONALUM #JSWSTEEL #NSE#MAITHANALL
NSE:MAITHANALL
CMP: 1050.15
TP: 1270 // 1300 // 1400
SL: 949
TF: <6m
RR > ~2.5 times
Return > ~24%
MAITHANALL
SAIL HINDCOPPER HINDZINC NIFTYMETAL TATASTEEL CNXMETAL HINDALCO JSWSTEEL NATIONALUM JINDALSAW JINDALSTEL COALINDIA NMDC GMDCLTD VEDL
Factors: BULLISH WEDGE BREAKOUT Trend Following Rising Volume with rising Prices. Flag pattern breakout. Pennant Pattern Breakout with Bullish Candle. Retest Successful. Higher Highs & Higher Lows. Broken above RESISTANCE levels Trading at SUPPORT levels Earnings are strong. Bullish Wedge Breakout Risk Return Ratio is healthy. And Rising from Double Bottom Pattern to Flag Pattern forming. If you like my work KINDLY LIKE SHARE & FOLLOW this page for free Stock Recommendations. With 💚 from Rachit Sethia

MaithanAlloysMaithan Alloys at bottom of longterm trend channel after what looks like a 1-2 of a new 5 wave move..
Wave3 if / when works out should yield good returns..

LONG TERM INVESTMENT
Start buying this Tock for the Long term (2-3 years)
Fundamentally strong stock
High Piotroski Score - Companies with strong financials
Strong Annual EPS Growth
Good quarterly growth in the recent results
Inverted Hammer (Bullish Reversal)
High Revenue and Profit Growth with High Return on Capital Deployed (ROCE) and Low PE ratio
High growth and High Return on Equity (ROE) with a Low PE ratio
Growth in Quarterly Net Profit with increasing Profit Margin (YoY)
Company with Low Debt
Company with Zero Promoter Pledge
FII / FPI or Institutions increasing their shareholding
Recent Results: Growth in Operating Profit with an increase in operating margins (YoY)

Maithan Mei-dhan?Money must be maid in this, good weekly chart for further upmove but daily tf suggests a dip to resolve neg divergence, a small dip should come, perfect to accumulate
maithan alloys longbreakout
cup and handle
bullish
good for long term
do your own research before investing
