MANAPPURAM FINANCE_Long-Support @ 20 DEMAMANAPPURAM FINANCE:
- Strong Green Candle with (Not so great) Volume
- Price takes support from 20 Daily EMA
- Hidden Bullish Divergence
- Watch this stock for good Entry point with tight SL
Next report date
—
Report period
—
EPS estimate
—
Revenue estimate
—
14.35 INR
12.16 B INR
100.07 B INR
547.22 M
About MANAPPURAM FINANCE LTD
Sector
Industry
CEO
Vazhappully P. Nandakumar
Website
Headquarters
Thrissur
Founded
1949
ISIN
INE522D01027
FIGI
BBG000FSNB56
Manappuram Finance Ltd. is a non-banking financial company, which engages in the provision of financial services, including gold loans, foreign exchange services, and remittances. The firm offers cash loan against gold pledge and also offers customers money transfers and foreign exchange services. It operates through Gold Loan and Others and Microfinance segments. The company was founded by V. C. Padmanabhan in 1949 and is headquartered in Thrissur, India.
Related stocks

Mannapuram Finance SellMannapuram Finance seems to take resistance at channel line. A lower top seems to form. Sell @CMP (275) with SL of 285 and target of 260 and 250.

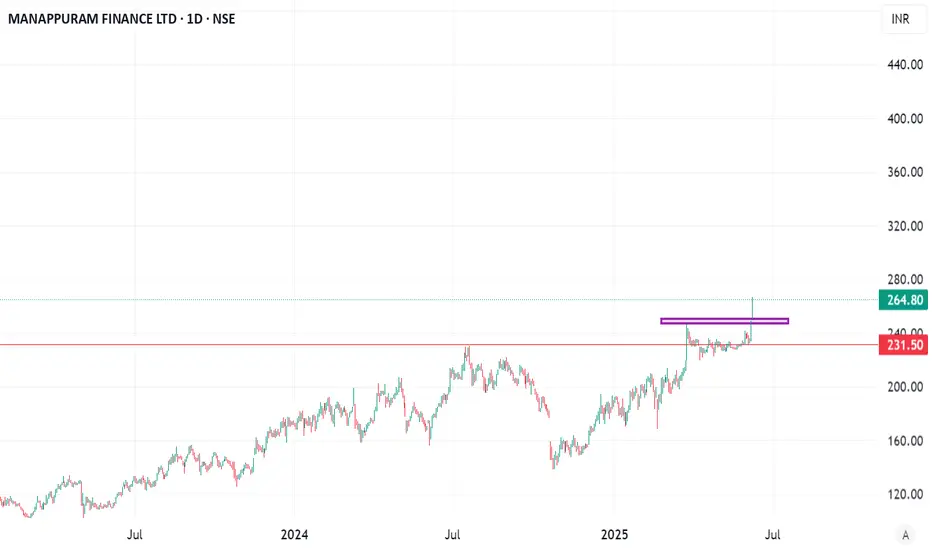
Positional Setup for Manappuram Finance Ltd (NSE)
From your TradingView chart:
CMP: ₹264.80
Breakout Zone: ₹245–248 (highlighted in purple)
Previous Resistance: ₹245–250 (now flipped to support)
Indicators:
Supertrend: ✅ Bullish
TEMA (5,9,20): ✅ Trending upward
Volume/Price Action: Sharp breakout candle with nearly 7% gain—strong confirmati
MANAPPURAM FINANCE_All time HighMANAPPURAM FINANCE:
- All time high
- Strong Green Candle with (Not so great) Volume
- Price takes support from 20 Daily EMA
- Watch this stock for good Entry point with tight SL
Disc: Educational Purpose only

manappuramThe gold loan provider said on Thursday Bain Capital will acquire an 18% stake in co at a premium to MNFL's last close

Manappuram Finance: Long-Term Breakout Alert🚀 Manappuram Finance: Long-Term Breakout Alert! 🚀
🔹 CMP: ₹230 | Stop Loss: ₹170 | Target: ₹290 | ₹372
🔍 Why Manappuram Looks Promising?
🔄 Technical Breakout:
A rounding bottom (or cup-and-handle) breakout with a well-defined base formation—indicating potential long-term upside.
📊 Accumulatio

Manappuram Buy With Target of 380If Manappuram Closes Above 230 Level in Monthly Candle, Possible to Touch 380 in Long Term

MANAPPURAM FINANCE POSITIVEWeekly strong positive close,
Daily candle close 10,20 ema Cross.
Tomorrow if 2hr candle close postive 210 up,then buy, sl 2hr candle low,
First target 220. Second target 230

Manappuram Finance Share Price Crash: Causes, AnalysisMANAPPURAM
On October 18th, 2024, the stock price of Manappuram Finance Ltd witnessed a sharp decline, raising concerns among investors. The company, known for its gold loan services, microfinance, and other financial offerings, experienced a drop in its stock value by nearly 33% from its all-time h

MANAPPURAM @Demand Areaprice taken the liquidity below equal lows at 156 levels.
previously a strong rise is observed from this levels..
we have a liquidity at resistance zone on topside....
this is the best area to continue in this stock for further upside movements.
Best area for long side continuation.

See all ideas
Summarizing what the indicators are suggesting.
Neutral
SellBuy
Strong sellStrong buy
Strong sellSellNeutralBuyStrong buy
Neutral
SellBuy
Strong sellStrong buy
Strong sellSellNeutralBuyStrong buy
Neutral
SellBuy
Strong sellStrong buy
Strong sellSellNeutralBuyStrong buy
An aggregate view of professional's ratings.
Neutral
SellBuy
Strong sellStrong buy
Strong sellSellNeutralBuyStrong buy
Neutral
SellBuy
Strong sellStrong buy
Strong sellSellNeutralBuyStrong buy
Neutral
SellBuy
Strong sellStrong buy
Strong sellSellNeutralBuyStrong buy
Displays a symbol's price movements over previous years to identify recurring trends.
MFLN5826340
Manappuram Finance Limited 7.375% 12-MAY-2028Yield to maturity
6.38%
Maturity date
May 12, 2028
See all MANAPPURAM bonds
Frequently Asked Questions
The current price of MANAPPURAM is 259.10 INR — it has decreased by −2.47% in the past 24 hours. Watch MANAPPURAM FINANCE LTD stock price performance more closely on the chart.
Depending on the exchange, the stock ticker may vary. For instance, on NSE exchange MANAPPURAM FINANCE LTD stocks are traded under the ticker MANAPPURAM.
MANAPPURAM stock has fallen by −4.43% compared to the previous week, the month change is a −5.13% fall, over the last year MANAPPURAM FINANCE LTD has showed a 26.51% increase.
We've gathered analysts' opinions on MANAPPURAM FINANCE LTD future price: according to them, MANAPPURAM price has a max estimate of 300.00 INR and a min estimate of 185.00 INR. Watch MANAPPURAM chart and read a more detailed MANAPPURAM FINANCE LTD stock forecast: see what analysts think of MANAPPURAM FINANCE LTD and suggest that you do with its stocks.
MANAPPURAM reached its all-time high on Jun 16, 2025 with the price of 284.90 INR, and its all-time low was 9.80 INR and was reached on Jul 16, 2013. View more price dynamics on MANAPPURAM chart.
See other stocks reaching their highest and lowest prices.
See other stocks reaching their highest and lowest prices.
MANAPPURAM stock is 3.49% volatile and has beta coefficient of 0.88. Track MANAPPURAM FINANCE LTD stock price on the chart and check out the list of the most volatile stocks — is MANAPPURAM FINANCE LTD there?
Today MANAPPURAM FINANCE LTD has the market capitalization of 224.81 B, it has increased by 2.99% over the last week.
Yes, you can track MANAPPURAM FINANCE LTD financials in yearly and quarterly reports right on TradingView.
MANAPPURAM FINANCE LTD is going to release the next earnings report on Aug 19, 2025. Keep track of upcoming events with our Earnings Calendar.
MANAPPURAM earnings for the last quarter are −2.40 INR per share, whereas the estimation was 2.22 INR resulting in a −208.11% surprise. The estimated earnings for the next quarter are 4.29 INR per share. See more details about MANAPPURAM FINANCE LTD earnings.
MANAPPURAM FINANCE LTD revenue for the last quarter amounts to 14.68 B INR, despite the estimated figure of 16.39 B INR. In the next quarter, revenue is expected to reach 14.29 B INR.
MANAPPURAM net income for the last quarter is −1.91 B INR, while the quarter before that showed 2.82 B INR of net income which accounts for −167.78% change. Track more MANAPPURAM FINANCE LTD financial stats to get the full picture.
MANAPPURAM FINANCE LTD dividend yield was 1.51% in 2024, and payout ratio reached 24.36%. The year before the numbers were 2.05% and 13.73% correspondingly. See high-dividend stocks and find more opportunities for your portfolio.
As of Jul 28, 2025, the company has 51.65 K employees. See our rating of the largest employees — is MANAPPURAM FINANCE LTD on this list?
EBITDA measures a company's operating performance, its growth signifies an improvement in the efficiency of a company. MANAPPURAM FINANCE LTD EBITDA is 38.96 B INR, and current EBITDA margin is 74.77%. See more stats in MANAPPURAM FINANCE LTD financial statements.
Like other stocks, MANAPPURAM shares are traded on stock exchanges, e.g. Nasdaq, Nyse, Euronext, and the easiest way to buy them is through an online stock broker. To do this, you need to open an account and follow a broker's procedures, then start trading. You can trade MANAPPURAM FINANCE LTD stock right from TradingView charts — choose your broker and connect to your account.
Investing in stocks requires a comprehensive research: you should carefully study all the available data, e.g. company's financials, related news, and its technical analysis. So MANAPPURAM FINANCE LTD technincal analysis shows the sell today, and its 1 week rating is buy. Since market conditions are prone to changes, it's worth looking a bit further into the future — according to the 1 month rating MANAPPURAM FINANCE LTD stock shows the buy signal. See more of MANAPPURAM FINANCE LTD technicals for a more comprehensive analysis.
If you're still not sure, try looking for inspiration in our curated watchlists.
If you're still not sure, try looking for inspiration in our curated watchlists.