Mangalam Cement: Profitable Long TradeTrade Overview: Mangalam Cement demonstrated a strong bullish move on the 15-minute chart, with all targets (TP1 to TP4) successfully achieved using the Risological Swing Trading Indicator . The trade capitalized on a well-timed entry near ₹919.05, with a stop loss (SL) set at ₹907.45, and hit the final target of ₹994.05, showcasing high accuracy.
Key Levels:
Entry Price: ₹919.05
Stop Loss: ₹907.45
Take Profits:
TP1: ₹933.35
TP2: ₹956.55
TP3: ₹979.75
TP4: ₹994.05
Fundamental Analysis: Recent news supports the price movement:
Strong Quarterly Earnings: Mangalam Cement reported a net profit of ₹32.8 million for the September quarter, signaling financial resilience.
Improved Profitability: The company has shown consistent growth in quarterly profits, boosting investor confidence.
Market Stats:
Current Price: ₹1,007.75 (+1.66%)
Volume: 142.78K (above average)
52-Week Range: ₹610.30 - ₹1,093.70
Mangalam Cement's robust fundamentals and the Risological Indicator's precision have once again delivered a profitable trade setup.
MANGLMCEM trade ideas

MANGLMCEMMANGLMCEM Stock:
Ready for a Breakout, It's Interesting to see in the coming days how it behaves. #flairinvestor

MANGLMCEM1. Anything can happen.
2. You don't need to know what is going to happen next in order to make money.
3. There is a random distribution between wins and losses for any given set of variables that define an edge. No other thoughts
4. An edge is nothing more than an indication of a higher probability of one thing happening over another.
5. Every moment in the market is unique.

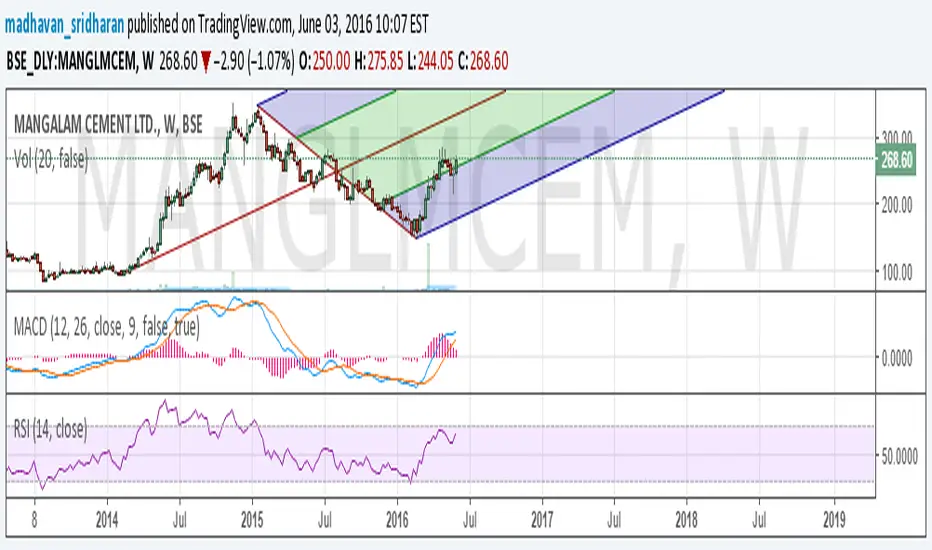
acceding Channel pattern 17 Years acceding Channel pattern Breakout. Risk 10% & Reward leave where can go grab as much possible.

#MANGLMCEMPositive factors
Improving scale of operation leading to increase in total operating income (to greater than ₹2,000 crore) and profitability
(profit before interest, lease rentals, depreciation and tax (PBILDT) margin greater than 18%) on a sustained basis
Improving capital structure (overall gearing less than 0.5x) and debt protection metrics (PBILDT interest coverage greater
than 5.0x) on a sustained basis
Negative factors
Lower-than-envisaged profitability leading to decline in PBILDT interest coverage going below 2.00x on sustained basis
Large-scale debt-funded capital expenditure (capex) leading to deteriorating capital structure

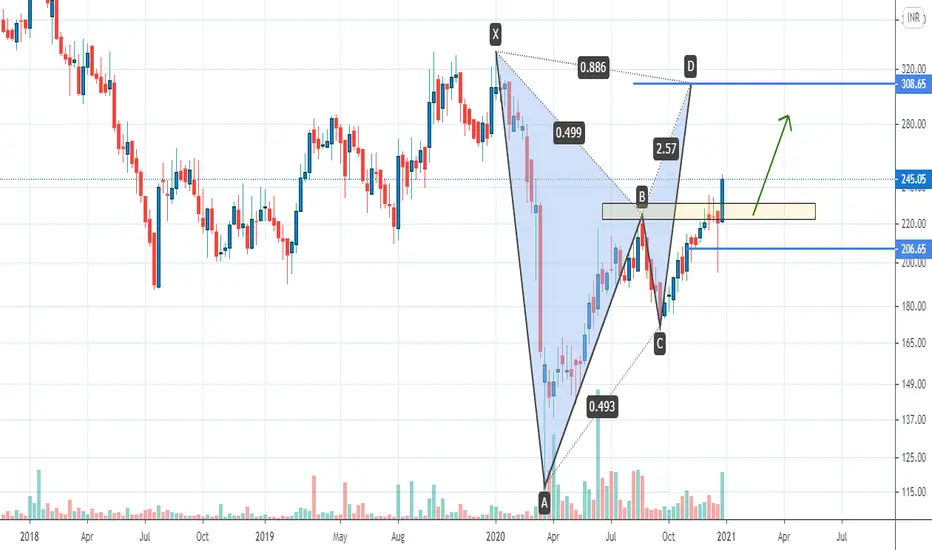
MANGALAM CEM Chart for studytell me which pattern form
DARWOX theory
or
DOW theory
and tomorrow which side will move

In-Depth Analysis of MANGLMCEM (NSE: MANGLMCEM)Technical Overview:
1. RSI Divergence and Weekly Chart Support:
MANGLMCEM's weekly chart indicates significant support at the Relative Strength Index (RSI) divergence. RSI is a momentum oscillator, and divergence can signal potential reversals or shifts in the prevailing trend. The presence of support on the weekly chart suggests a strong technical foundation.
Fundamental Highlights:
1. Q3 Earnings Performance:
The recent financial results for Q3 reveal a substantial improvement in EBITDA, reflecting robust operational performance. The EBITDA margin has notably increased, showcasing enhanced profitability. The substantial growth in net profit on both a year-on-year (YoY) and quarter-on-quarter (QoQ) basis further strengthens the positive narrative.
2. Revenue Growth:
Q3 revenue growth, both YoY and QoQ, underscores the company's ability to generate increased sales, contributing to overall financial strength.
Trade Execution Strategy:
Entry:
Consider entering a long position at the current market price (CMP) of 666.3. This entry aligns with the technical support identified on the weekly chart and is further reinforced by the positive fundamental developments.
Stop Loss Placement:
Place a stop loss at 610. This stop loss level is strategically chosen to provide a reasonable buffer against potential price fluctuations while safeguarding the trade from adverse market movements.
Target Setting:
Set a target of 780. The target is determined based on the technical support and the positive fundamental backdrop. It reflects an anticipated upward price movement.
Risk Factors and Considerations:
1. Market Conditions:
Keep an eye on broader market conditions and potential external factors that may impact the stock or overall market sentiment.
2. Corporate Developments:
Stay informed about any corporate developments, announcements, or industry-specific news that could influence the stock.
3. Continuous Monitoring:
Regularly monitor the trade for any shifts in the technical setup or unforeseen market developments. Be prepared to adjust the strategy based on evolving conditions.
Conclusion:
MANGLMCEM presents an intriguing opportunity with a combination of technical support and positive fundamental indicators, particularly strong Q3 earnings. The trade is initiated with a comprehensive risk management strategy. Regular monitoring and adaptability are key to navigating dynamic market conditions.

MANGALAMCEMENT DAILY CHARTMangalacement has given a swing breakout.
Cmp 319.65 Target 377 Breakout 301

💥Mangalam Cements💥-Nice Breakout💥Mangalam Cements💥-Nice Breakout
Capital to be deployed- 20k
Investing Price -405-410
Breakout Price-400
Stoploss-333
Targets-530-670-934
RT for max reach
#mangalamcements #StocksToBuy #stocks #StocksToTrade #StocksInFocus #stockstowatch #StocksInNews

Swing trading ideaMANGALAM CEMENT did weekly resistance breakout with huge volume which was created with huge gap up we can play this as swing trade for the target of 30% to 35 % with the SL of 8%.

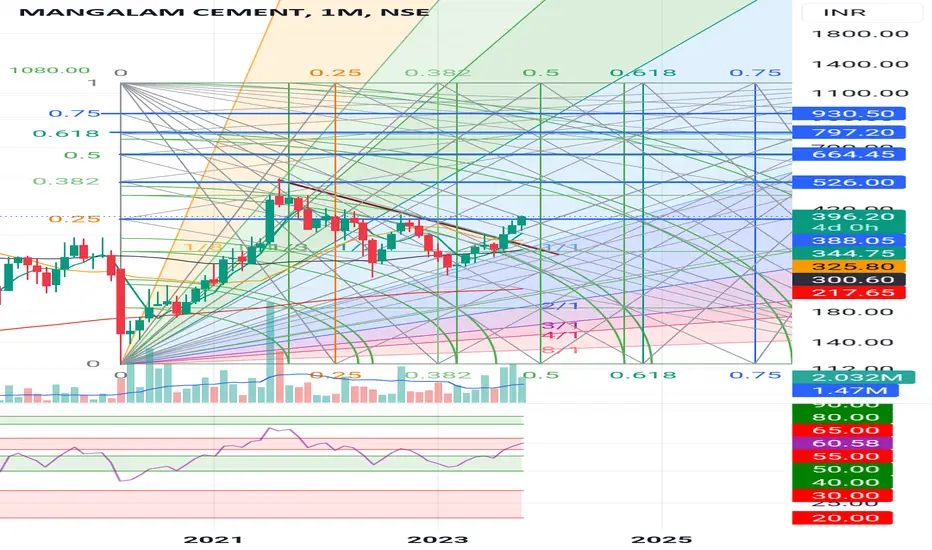
Mangalam CementsLooking really good after breaking out one of the important Gann levels and huge volumes being seen for the last few months
Follow the levels marked on the chart for the SL and the targets
Cup and Handle Breakout for Mangalam Cement looks like.Mangalam Cement is a B.K. Birla Group company, producing cement in various grades using the dry process and marketing under the brand name of "Birla Uttam". Mangalam Cement CMP is 332.20.
The negative aspects of the company are high valuation (P.E. = 53.3) and declining cash from operations. Positive aspects of the company are low debt, promoter holding increasing, FIIs are increasing stake and zero promoter pledge.
Entry after closing above 343. Target of the call will be 356 and 367. Long term targets in the stock will be 388. Stop loss in the stock should be maintained at closing below 300.

Reversal VisibleThis counter can move up to 335 in the next few weeks. One should track this counter for knowledge purposes. At attractive valuations and reverse zones on technical charts.

Buy if breakout happens with good volumeThis can be a good short term trade above 394 if breaks with good vol. Target 423,467.Good Luck :)


Mangalam Cement: Is It Ready For Next Leg Up?After a nice downside correction, the next leg of uptrend seems underway. Another stock in my momentum Watchlist