Do you use Camphor at Home!?Here is the world's largest manufacturer of Camphor. Mangalam Organics!
And the Camphor price is moving Up; check out - WPI at DPIIT.
The financials are looking stable.
For at the Sector rotation N Chemicals Play, this seems attractive. But being the MicroCap may pose quick corrections and sudde
14.65 INR
125.97 M INR
5.30 B INR
8.09 M
About MANGALAM ORGANICS LTD
Sector
Industry
CEO
Sanjay Bhardwaj
Website
Headquarters
Mumbai
Founded
1946
ISIN
INE370D01013
FIGI
BBG000C1W294
Mangalam Organics Ltd. engages in the manufacturing of chemicals. Its products include resin and terpene, which offers camphor, dipentene, gum resin and sodium acetate. The company was founded by Ramgopal M. Dujodwala in 1946 and is headquartered in Mumbai, India.
Related stocks

#MANGALAM ORGANIC LTD + PTT + LR + FIBO RETRACEMENTThe green candle stick is rising with confidence . It is trading above the resistance line generated by linear regression . The price is well above the PTT bands .
The fibo retracements show important levels to watch for.

Mangalam organic looks good for 450Already made a botom breakout
Now tested 10ema support
It bounces from 10ema
Target would be 450
Stop 400
Risk reward 1:2
Swing trade..15 days period
Mangalam Organics Limited (MOL) are Prime Manufacturers of Camphor, Resin and Sodium Acetate. The management has over 50 years of experience in the pi

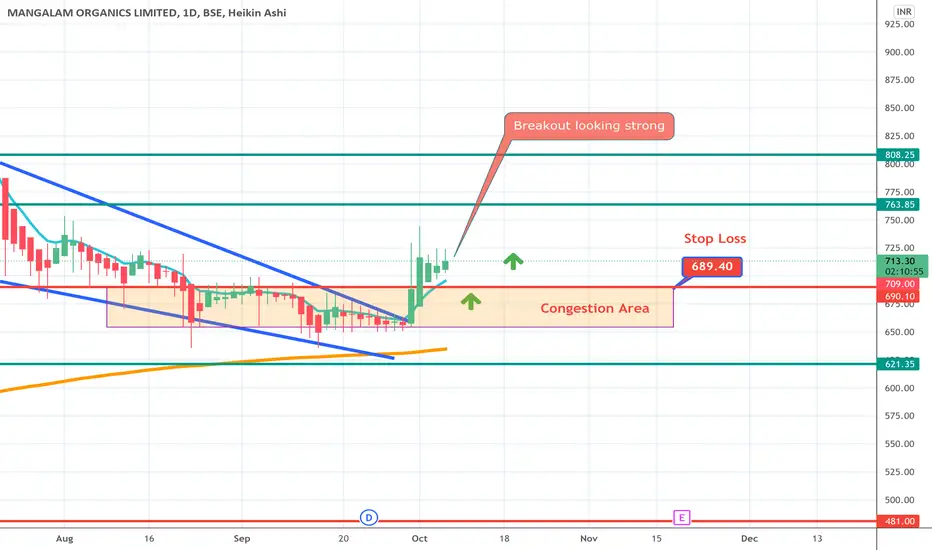
Breakout Looking StrongBreakout is looking really good. I'm dibbling in here with a few shares. Will add more in the coming days.
Use 700 to 695 as stop loss.
Target 1 : 763
Target 2 : 808
Target 3: 850+ if the next quarter results turn out to be good. A very high chance given sep is usually its best quarter.
If the p

See all ideas
Summarizing what the indicators are suggesting.
Oscillators
Neutral
SellBuy
Strong sellStrong buy
Strong sellSellNeutralBuyStrong buy
Oscillators
Neutral
SellBuy
Strong sellStrong buy
Strong sellSellNeutralBuyStrong buy
Summary
Neutral
SellBuy
Strong sellStrong buy
Strong sellSellNeutralBuyStrong buy
Summary
Neutral
SellBuy
Strong sellStrong buy
Strong sellSellNeutralBuyStrong buy
Summary
Neutral
SellBuy
Strong sellStrong buy
Strong sellSellNeutralBuyStrong buy
Moving Averages
Neutral
SellBuy
Strong sellStrong buy
Strong sellSellNeutralBuyStrong buy
Moving Averages
Neutral
SellBuy
Strong sellStrong buy
Strong sellSellNeutralBuyStrong buy
Displays a symbol's price movements over previous years to identify recurring trends.
Frequently Asked Questions
The current price of MANORG is 479.30 INR — it has decreased by −2.90% in the past 24 hours. Watch MANGALAM ORGANICS LTD stock price performance more closely on the chart.
Depending on the exchange, the stock ticker may vary. For instance, on NSE exchange MANGALAM ORGANICS LTD stocks are traded under the ticker MANORG.
MANORG stock has fallen by −2.81% compared to the previous week, the month change is a −19.77% fall, over the last year MANGALAM ORGANICS LTD has showed a 17.48% increase.
MANORG reached its all-time high on Nov 10, 2021 with the price of 1,299.00 INR, and its all-time low was 270.00 INR and was reached on Mar 28, 2024. View more price dynamics on MANORG chart.
See other stocks reaching their highest and lowest prices.
See other stocks reaching their highest and lowest prices.
MANORG stock is 6.37% volatile and has beta coefficient of 1.02. Track MANGALAM ORGANICS LTD stock price on the chart and check out the list of the most volatile stocks — is MANGALAM ORGANICS LTD there?
Today MANGALAM ORGANICS LTD has the market capitalization of 4.08 B, it has decreased by −2.79% over the last week.
Yes, you can track MANGALAM ORGANICS LTD financials in yearly and quarterly reports right on TradingView.
MANORG net income for the last quarter is 51.37 M INR, while the quarter before that showed 36.37 M INR of net income which accounts for 41.25% change. Track more MANGALAM ORGANICS LTD financial stats to get the full picture.
MANGALAM ORGANICS LTD dividend yield was 0.00% in 2024, and payout ratio reached 0.00%. The year before the numbers were 0.00% and 0.00% correspondingly. See high-dividend stocks and find more opportunities for your portfolio.
EBITDA measures a company's operating performance, its growth signifies an improvement in the efficiency of a company. MANGALAM ORGANICS LTD EBITDA is 585.79 M INR, and current EBITDA margin is 11.05%. See more stats in MANGALAM ORGANICS LTD financial statements.
Like other stocks, MANORG shares are traded on stock exchanges, e.g. Nasdaq, Nyse, Euronext, and the easiest way to buy them is through an online stock broker. To do this, you need to open an account and follow a broker's procedures, then start trading. You can trade MANGALAM ORGANICS LTD stock right from TradingView charts — choose your broker and connect to your account.
Investing in stocks requires a comprehensive research: you should carefully study all the available data, e.g. company's financials, related news, and its technical analysis. So MANGALAM ORGANICS LTD technincal analysis shows the sell today, and its 1 week rating is sell. Since market conditions are prone to changes, it's worth looking a bit further into the future — according to the 1 month rating MANGALAM ORGANICS LTD stock shows the buy signal. See more of MANGALAM ORGANICS LTD technicals for a more comprehensive analysis.
If you're still not sure, try looking for inspiration in our curated watchlists.
If you're still not sure, try looking for inspiration in our curated watchlists.