Long with Risk of 1% and RR of 1:2Long with Risk of 1% and RR of 1:2
NOTE: You should not engage in trading unless you fully understand the nature of the transactions you are entering into and the extent of your exposure to loss. If you do not fully understand these risks you must seek independent advice from your financial advisor. All trading strategies are used at your own risk."
MARUTI trade ideas

MarutiEnter above 8000, Favorable risk to reward. Inverted head and shoulder patter formation. Auto sector is bullish as well.

Marutisuzuki can retrace from current level1. Evening star in daily time frame at top
2. at important resistance
3. RSI negative divergence

Maruti 10000+ ViewMaruti gearing up to move upwards.
As you cab see this is a long term analysis via weekly chart.
Stock has formed an inverted Head and shoulders patterns.
breaking out from this can lead to previous highs of 10k+
Follow idea to get new breakout levels and stay updated!!


MARUTI WAITING FOR NEXT MOVEMaruti is now going to boom boom . it reaches to weakly resistance of trend line just wait for break out and retest to enter.

MARUTI WEEKY CHART It is tradng around falling trendline resistence , double bottom made , best buy in 7550-7600 zone , tgt 8000/8400/9000 ,big hurdle 7800

MARUTI HEAD AND SHOULDER PATTERN.. NSE:MARUTI Please note that we are not a SEBI Registered Investor Adviser/PMS/ Broking House.
All the contents over here are for educational purposes only and are not investment advice or recommendations
offered to any person(s) with respect to the purchase or sale of the stocks / futures and options.
You are also requested to apply your prudence and consult your advisers in case you choose to act on
any such content available as WE claims no responsibilities for any of your actions or any outcome of
such action

MarutiExpecting big upside move above trend line.... Harmonic pattern and cup and handle pattern formed on chart...... Target 9000+ expected


Flag Pattern Break Out Imminent On Maruti SuzukiFor my first ever TradingView post, here is a trade brought to you for free. As you can see in the image the flag patterns that Maruti Suzuki has been forming at 15 min timeframe. DO NOT CONSIDER IT A CALL. You can analyse for yourself as per the image provided and then put your thought in comment section if I made any errors. (Don't know if TradingView has one). NSE:MARUTI

Maruti Falling Trendline BreakoutMaruti has given a breakout above the falling trendline on daily chart. Overall, Auto sector has started moving up and should see some short covering in coming days.
Initial Target 7800-8000

MARUTI LONGMaruti Elite wave formation,
Maruti running price is 6950 target accepted based on elite wave 12600 & 14000+

MARUTI SUZUKI ANALYSIS.MARUTI SUZUKI Simple Price Action Analysis.
Please comment and correct me if you feel anything.

MARUTI has taken support around 6750 levelsNSE:MARUTI is showing some signs of weakness for the last 2 days. It has again taken a support at 6750 levels.

maruti look good for swingcan go long above 6955, looks bullish on chart can take target 7200 7300 7500

MARUTI cup and handle pattern breakoutMARUTI cup and handle pattern breakout with volume
Expecting a bullish movement.


MarutiDouble Bottom Pattern
Breakout and ready for upside move
Long term view- 7800
Monthly/Quarterly 7200


Maruti Support levelsMaruti Support levels seen at 6400, 5500, 4000, Levels shared for study purpose along with Fibonacchi retracement

Maruti Chart Update Looks BullishMaruti Chart Update Looks Bullish
We can enter for Long side with small SL and target of 7200

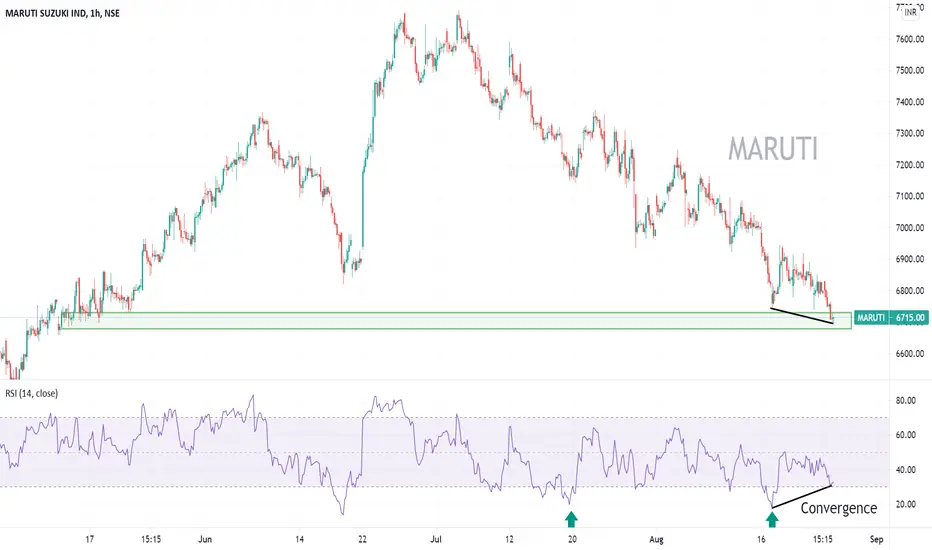
MARUTI - Possible reversal Should probably reverse from here
1. Convergence with RSI
2. Pin bar formation at DD zone.l
3. Watch the RSI movement from the same position Historically.