MARUTI SUZUKI INDIA LTD 45MIN BULLISH BUTTERFLY
price need to follow Green Trend line & hit target
If price Breaks Red Trend line is where EXIT before SL hits
POTENTIAL BUY
MARUTI trade ideas

Maruti
Disclaimer
I am not sebi registered analyst
My studies are Educational purpose only
Please consult with your Financial advisor before trading or investing


Up? Just finding possibility. Not any trading or investment advice.
if sustained 7100 can hit 7400. If crossed 7450.. May be more upside.

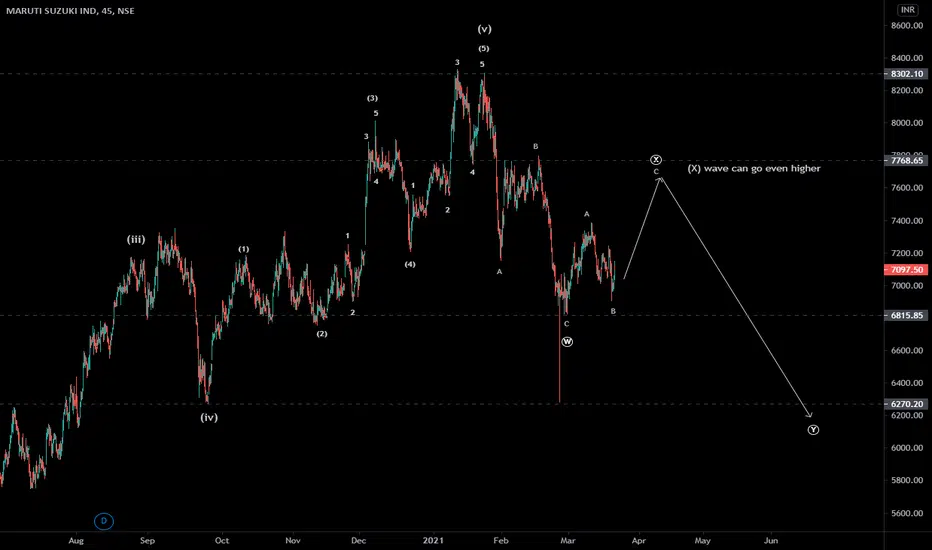
MARUTI - Elliott wave analysis - correction down It dropped in zigzag wave, so it is possibly bounces in zigzag or flat correction as wave (X) (or B) wave. The current move is the part of (X) wave and bounces up to 7600 to 7800. Then only it will go down in next zigzag down. In bigger time frame it can form ABC flat also and in that case it can go up to 8200 level as alternate count.

Maruti long !?Maruti bounced from support level once again. Only worry is how index behaves. Buy abv 7101.5 stop below 7060 is primary cosideration. Possible tgts marked.
This is just my personnel view. Not any trading or investing advice.


Lower Low / Higher low PatternHello Traders, it looks like making the Lower Low pattern, if it is like that it must touch the level 6550. So trade with care and keep position on short side till the pattern is going on, good luck!!

Stock For 10 March 21👁 Marked Levels of MARUTIStock For 10 March 21👁
Marked Levels of Maruti, Buy Above Target already mentioned in Chart
Please keep the stock in your watchlist & Observe the market movement first then only take your Trades


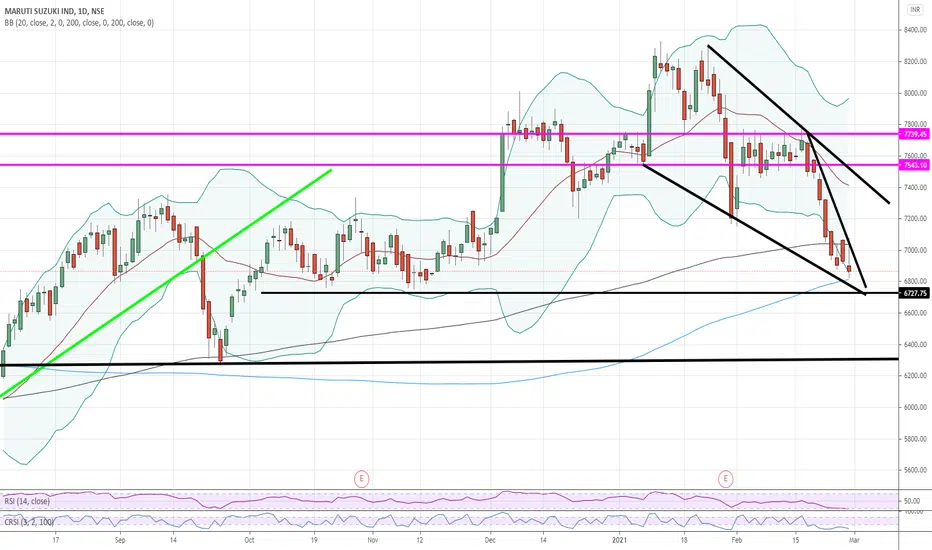
Maruti - Head and Shoulder in Daily Chart PatternMaruti is forming H&S pattern on daily chart. Trading below its critical moving averages, looks like sell on rise candidate. If breaks 7200 levels then can give a bigger downside.

MARUTI SUZUKI IND - Under Bullish WedgeBullish Wedge and Clearly bouncing off 200 Daily MA
Buy if Break Above The Wedge
Targets in green


Marutimaruti decent levels for long accumulations ( trade valid only if maruti trades above 7035 on closing basis ) sl -6900 tgt -7700
"NSE:MARUTI" - "SELL" signal 1 hr timeframe (Solved Signal 1)-SELL signal generated by "Solved Signal 1(SS1)" in 1 hr Chart of "NSE:MARUTI"
-"NSE:MARUTI" 1 hr chart
- Indicator used "Solved Signal 1(SS1)"
-Solved Signal 1 generates SELL signal(by default: text:- SS1, color= red,shape=triangledown)
on 1 hr chart of "NSE:MARUTI" .It means "NSE:MARUTI" can go down.
-Solved Signal 1 uses "NSE:MARUTI" Price data for Solving the Market(See description of Indicator).
-Like and Comment. NSE:NIFTY BSE:SENSEX

Buy in staggered way (Cash segment only)Hello traders, i think its a time to buy MARUTI in staggered way, there are only 2 levels in lower side (6900 & 6750) to support (strong). let see how the market respect these levels ! have a good luck !


MarutiKey levels are mentioned on chart, those are working as support as well as Resistance
Disclaimer
I am not a sebi registered analyst
My studies are Educational purpose only
Consult with your Financial advisor before trading or investing

