MARUTI trade ideas

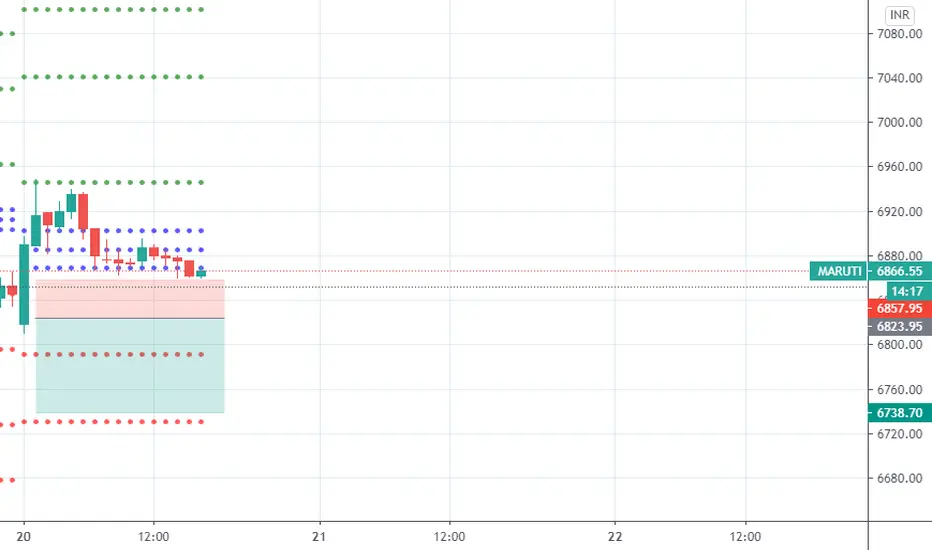
MARUTI LOOK OUT FOR THESE LEVELS!!! ALL THE LEVELS AND PATTERNS ARE MARKED ON CHART, RED ZONES DENOTES SUPPLY ZONES AND GREEN IS FOR DEMAND ZONE .
7050-7035 CAN ACT AS GOOD RESISTANCE
BUY ABOVE IT IF THE LEVEL IS BROKEN WITH VOLUME AND CONVICTION.
The indicator used:
1) Daily Lines plots Daily 20 (BLACK) & 50 EMA (GREY) on lower time frame charts
2) TE-REKAB
- PB : PULLBACK
If you like the analysis, do leave a like and follow for more such content coming up.
The analysis is my POV, hope you got bucks in your pocket to consult a financial advisor before investing :P :)
HAPPY TRADING!

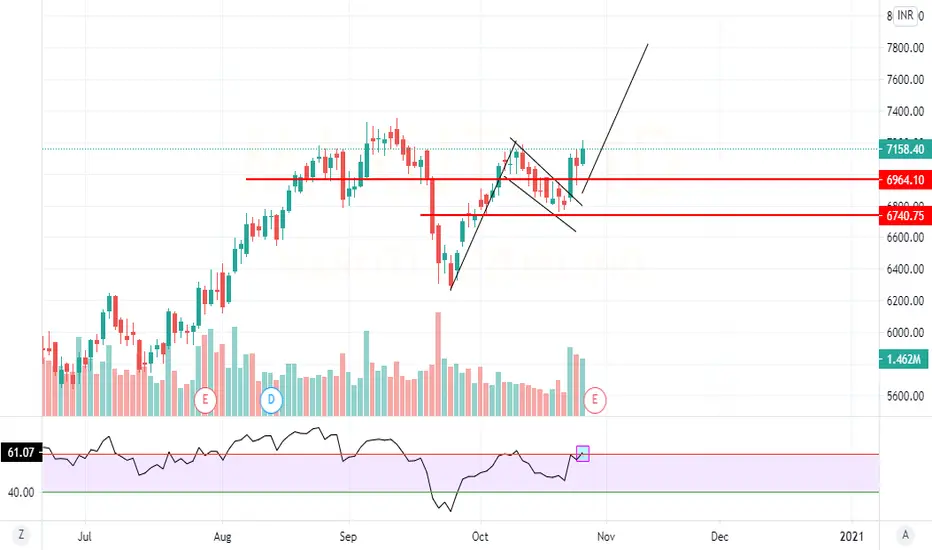
Symmetrical Triangle Breakout in "Maruti" - Bull Call Spread.Maruti has broken its symmetrical triangle on the upper side expecting a target of of 8000-8200 in the month of December.
Bull Call Spread on Maruti
+1x 31DEC2020 7200CE - ₹ 303.5
-1x 31DEC2020 8000CE - ₹ 72.25
Max. Profit - ₹ +56,875
Max. Loss - ₹ -23,125
Max. RR Ratio - 1:2.45
Breakeven - 7432
Estimated Margin/Premium - ₹23,000-- ₹25,000

MARUTI LOOK OUT FOR THESE LEVELS!!! ALL THE LEVELS AND PATTERNS ARE MARKED ON CHART, RED ZONES DENOTES SUPPLY ZONES AND GREEN IS FOR DEMAND ZONE .
SELLING VOLUME HAS DECREASED, I WILL WAIT FOR CONFIRMATION BEFORE TAKING ANY SIDE TRADE.
The indicator used:
1) Daily Lines plots Daily 20 (BLACK) & 50 EMA (GREY) on lower time frame charts
2) TE-REKAB
- PB : PULLBACK
If you like the analysis, do leave a like and follow for more such content coming up.
The analysis is my POV, hope you got bucks in your pocket to consult a financial advisor before investing :P :)
HAPPY TRADING!


Maruthi - short term break out above trend lineMaruti CMP is 6981 - has been broken out above its short term trend line and may go near to 7300++ recent one month high.

Triangle pattern breakout -Tomorrow watchout6772 is a good support line for maruti, so it should bounce from here.Lets wait and watch.
Short if it breaks the support.

Maruti (At a Crucial Juncture ?)Maruti has formed a beautiful long term triangle and now looks like it is on the verge of a breakdown/reversal. In case of a breakdown multiple targets can be set which the green/yellow lines acting as Stoploss (9EMA (Green Line) and 50 EMA (Yellow Line). The Red line could be the first target (200EMA), however if the trend is strong the price might continue to slide down. On the upper end the yellow lines could act as resistance and hence trade targets.
The market as of this week should ideally pick up a short term trend on the back of Joe Biden being elected as president and hence the sentiment/price action shall follow. Some Volatility might be expected on the back of announcements made by the incoming president or any hurdle posed by trump which he is likely to do and there might be a sudden reversal in the trend.
So as for a trader these situations can be very tricky and might cause losses in a very short time. Please be careful and trade with caution.


MARUTI SUZUKI IND 4HRCONFLUENCE OF DAILY & 4HR BEARISH BAT
price need to follow Green Trend line & hit target
If price Breaks Red Trend line is where EXIT before SL hits
POTENTIAL SELL

MARUTI SUZUKI IND Daily BEARISH BAT
price need to follow Green Trend line & hit target
If price Breaks Red Trend line is where EXIT before SL hits
POTENTIAL SELL


Maruti appears strong upside momentumIf maruti breaks and sustain above 7350. One can open long position till the 7700.
This is my view only


MARUTI SUZUKI Weekly Chart - PositionalThis analysis is purely based on Price Action & Chart Patterns
Analysis is done on Weekly Time Frame, Hence it may take few weeks to couple of months for price to reach target. Traders should consider this before entering into the trade.
As can be seen, Price has been testing the resistance trendline multiple times.
But this time, after getting rejected from that resistance level , it took good support from 200EMA and appears to be consolidating
and again ready to test that resistance level .
Trade Strategy -
(1) Entry to be made on the high of breakout candle. (Traders can wait for weekly closing candle or may enter in 50% qty on daily closing basis and rest 50% on confirmation with Weekly Closing). SL below 6239 level. SL to be trailed accordingly
(2) if breakout candle is big, then wait for retest and then enter. Put SL little below that recent swing. This may give much better Reward to Risk Ratio.
(3) If price consolidates below this trendline by taking good support of 200EMA without making any new low.. then one can enter on high of green candle with increased volume and SL can be right below that consolidation zone.
*Trade on your own risk and money management*
Feel Free to comment for any queries or suggestions

daily analyses of MURATI SUZUKI IND Hi friends
the daily chart shows with a high probability an uptrend in the coming days
please subscribe to receive more analysis


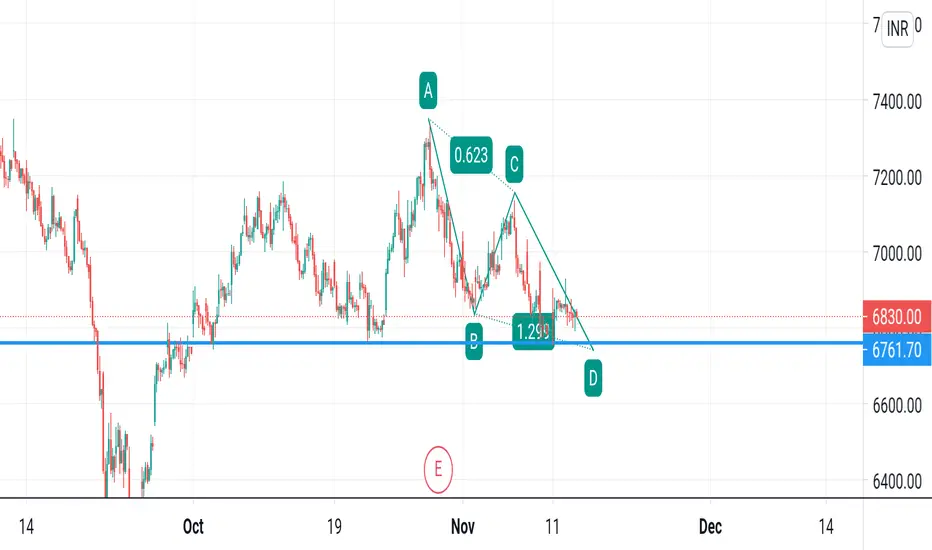
Maruti (NSE) - Elliott wave analysis Welcome guys,
CycleWave is the top author sharing trade ideas based on EW analysis since last five months on the global stocks, currency pairs, cryptos, future indices and commodities. You can follow us to get more trade ideas/analysis.
MARUTI (NSE) - It has completed either 3rd of impulse up or ABC zigzag from major low in 4 hr time frame. Now it is correcting down, where A wave was impulse down and B is in ABC zigzag, which might be finished. But wait for confirmation to get in to sell trade set up. Stay bearish below 6673 once the price confirm the down cycle.
Give thumbs up if you really like the trade idea.
