MAZAGON DOCK SHIPBULL looking strong 2 hrs ( short to medium tLOOKING stable and strong bullish contracting triangle
pattern suggest us abv 3284 closing
price action may show some strength
These classic patterns sometime shows sparkle in price action
pattern may be wrong
do your analysis
this is for educational purpose
MAZDOCK trade ideas

Mazdock - Cup pattern breakout and pullbackMazagon Dock Shipbuilders Ltd.
Cup pattern breakout and in pullback on Weekly timeframe.
Close within 52 week zone.
Strongly outperforming sectoral and benchmark index.
Decreasing Relative strength.
Close crossing last week low.
Disclaimer:
For educational purpose only.
Please do your own research before taking any trades.
Happy Trading!

Review and plan for 30th May 2025Nifty future and banknifty future analysis and intraday plan.
Quarterly results.
This video is for information/education purpose only. you are 100% responsible for any actions you take by reading/viewing this post.
please consult your financial advisor before taking any action.
----Vinaykumar hiremath, CMT

MazdockMazdock after giving a nice beeakout , its still good fr a positional hold . Script has potential to make a new high! 💫

MAZDOCK - Buy setupBroke all time high with good volume.
Targets - 3500, 4000
Stop loss could be Daily close below Previous ATH

Mazdock📈 Final Trade Plan – Mazdock
Component Value
Trade Direction BUY
Entry Price 3148
Stop Loss (SL) 2776
Risk 372
Target Price 4156
Reward 1008
Risk-Reward Ratio 2.7
Last Swing High 2926
Last Swing Low 1918
📊 Mazdock – Multi-Timeframe Demand Zone Analysis
🔹 Higher Timeframe (HTF) Zones
Timeframe Trend Demand Logic Type Proximal Distal Avg Zone
Yearly UP Yearly Demand Rally–Rally 2930 1918 2424
Half-Yearly UP 6M Demand BUFL 2930 1918 2424
Quarterly UP Qtrly Demand BUFL 2930 1918 2424
HTF Avg 2930 1918 2424
🔹 Medium Timeframe (MTF) Zones
Timeframe Trend Demand Logic Type Proximal Distal Avg Zone
Monthly UP Monthly Demand BUFL 2930 2100 2515
Weekly UP Weekly Demand SOE 3172 2776 2974
Daily UP Daily Demand DMIP 3230 3038 3134
MTF Avg 3111 2638 2874
🔹 Intraday Timeframe (ITF) Zones
Timeframe Trend Demand Logic Type Proximal Distal Avg Zone
240 Min UP 240M Demand BUFL 2924 2886 2905
180 Min UP 180M Demand BUFL 2932 3038 2985
60 Min UP 60M Demand BUFL 2932 3038 2985
ITF Avg 2929 2987 2958
🧠 Trade Point Summary
Category Proximal Distal Avg Zone
Trade Points 2990 2514 2752
🧩 Strategic Commentary
✅ Positives:
Strong Uptrend across HTF, MTF, and ITF.
Entry sits above daily demand zone (3230–3038) and very close to weekly zone (3172–2776) – giving trade strong bullish structure.
Demand cluster around 2900–3100 suggests that pullbacks will be supported, increasing conviction.
⚠️ Risk Considerations:
Risk is high (₹372) in absolute terms → lot sizing must be conservative.
Entry at 3148 is already above most demand zones, which means RR of 2.7 is decent but not extremely favorable compared to prior examples like JWL.
Swing High (2926) is below your entry, implying price is currently in price discovery territory → no strong ceiling nearby, but also untested waters.
🧠 Tactical Play Suggestions
Safer Entry Option: Watch for retest near 3038–3070 (Daily Distal or inside Weekly zone) before full position.
Trailing SL Strategy: If price crosses 3230, consider trailing SL to just above 3038 to reduce risk.
Breakout Add-on Entry: If 3230–3250 range breaks with strong volume, consider scaling up towards the 4156 target.

Mazdock can give its third base Breakout. Leading defence stock Mazdock firstly in all defence stocks , it can give its third base breakout. due to india pak war defence stock can give a rally.

MAZAGON DOCK SHIPBUILRetest of the Neckline: After the breakout, the price has come back down to retest the neckline. This is a normal and healthy move to confirm the previous resistance as a new support.
If the price bounces from this neckline support, there is a strong possibility of an upward move, with the next target potentially around 3,400–3,600.
However, if the price breaks below this neckline support, the pattern may fail, and the price could fall to around 2,600 or lower.
If you find this helpful and want more FREE forecasts in TradingView, Hit the 'BOOST' button
Drop some feedback in the comments below! (e.g., What did you find most useful?
How can we improve?)
Your support is appreciated!
Now, it's your turn!
Be sure to leave a comment; let us know how you see this opportunity and forecast.
Have a successful week
DISCLAIMER: I am NOT a SEBI registered advisor or a financial adviser. All the views are for educational purpose only

mazagon dock looks niceMazagon dock - looks good. i opened it up cuz war starting and ships needed. and its above all time high(recent breakout). with a retrace. also a round bottom. looks gud

How I traded Defence Stocks last weekThis is a video about how I approach swing trading in stocks In this video I have covered Defense Stocks which were a flavor of last week

BO and entry wait for the retest 📊 Chart Overview:
Current Market Price (CMP): ₹2,996.60
Previous Resistance Level: Around ₹2,878.35 (now potentially acting as support)
Recent Price Action:
Strong bullish breakout above previous resistance.
Followed by a red candle (possible profit booking or retest of breakout zone).
🔍 Technical Insights:
Breakout Confirmation Zone:
The price has broken out from a previous resistance zone (~₹2,878) with strong momentum.
It's now hovering slightly above this level.
Volume Analysis:
Volume on the breakout was significantly higher than average (suggesting strength).
Pullback candle shows reduced volume, indicating it may just be a minor correction.
Trend Structure:
Higher highs and higher lows forming since February 2025 — clear uptrend.
Retest of breakout zone may offer a low-risk entry.
📈 Suggested Trade Plan (Short-Term Swing)
✅ Entry:
Ideal Buy Zone: ₹2,930 – ₹2,975 (on a retest or small dip near breakout support at ₹2,878)
Confirmation Entry: Above ₹3,025 with strong volume (if price bounces strongly from here)
🎯 Target Levels:
T1: ₹3,150 (recent swing high)
T2: ₹3,300 (psychological round level)
T3: ₹3,450 (Fibonacci extension zone, if momentum continues)
🛑 Stop-Loss:
Conservative SL: ₹2,870 (below breakout support)
Aggressive SL: ₹2,825 (below last swing low from April)
🔄 Alternate Scenario:
If the price breaks below ₹2,870 with strong volume, avoid long entries. Wait for stability or signs of reversal before re-entering

Title: “Mazagon Dock: History Repeats? Chart Pattern Suggests AnTitle: “Mazagon Dock: History Repeats? Chart Pattern Suggests Another Breakout Ahead!”
Description: Mazagon Dock Shipbuilders Ltd (MAZDOCK) is showing a strong resemblance to its previous bullish pattern from early 2024. The highlighted ellipses show two nearly identical consolidation and breakout formations. The blue projection line mirrors the past 2024 price movement, suggesting a potential rally.
Key Levels to Watch:
Resistance: 3095 — if broken, expect a move toward 3148.
Support Zone: Around 2930-2970.
If the pattern continues, we could see a strong upward move. This setup is a great example of price action repeating itself—classic case of a fractal pattern in technical analysis.
Idea Type: Bullish | Timeframe: 1D
👉 Note: Always manage risk. Patterns can fail—set your stop loss wisely!

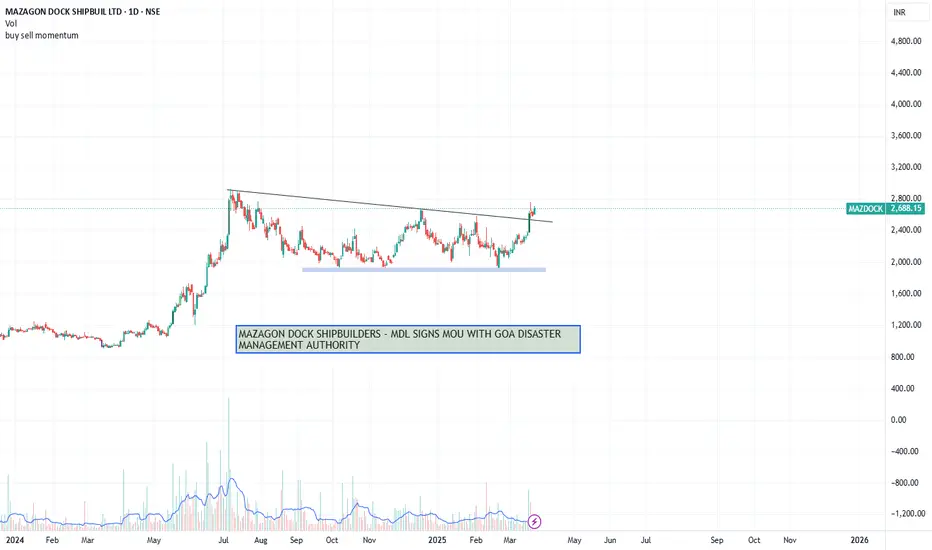
looks good for 4400MAZAGON DOCK SHIPBUILDERS (MDL) has signed a Memorandum of Understanding (MOU) with the Goa Disaster Management Authority. This agreement aims to collaborate on initiatives related to disaster management in the region. Through this partnership, MDL and the authority will work together to improve disaster preparedness, response, and recovery efforts in Goa, leveraging MDL's resources and expertise in support of the community's safety and resilience.
Strong month chart , holding support zoneThe company is among India’s leading shipbuilding yards, specializing in constructing and repairing warships and submarines for the Ministry of Defence and commercial vessels. It is the only Indian shipyard to have built destroyers and conventional submarines for the Navy, among the first to manufacture Veer and Khukri-class corvettes, and a lead builder of 4 Nilgiri-class stealth frigates. It is the only shipyard to be conferred with the Navratna status.

Mazdock: Reversal from Strong Support with Volume1. Strong Support Zone Holding
Mazdock has rebounded from a key support level, confirming buying interest.
Multiple touches at this level indicate a strong demand zone.
2. Volume Surge on Reversal
Increased buying volume signals institutional accumulation.
3. Potential Targets & Stop-Loss
Immediate resistance: Near previous swing high.
Breakout target: Box pattern height added to breakout level.
Stop-loss: Below recent support or breakout candle low.

Stock Analysis – Mazagon Dock Shipbuilders Ltd (MAZDOCK)📅 Date: January 30, 2025
📊 Timeframe: Daily Chart
📌 Market Snapshot
Change: +147.80 points (+6.29%)
🔴 Key Resistance Zones (Above Current Price)
🚀 2,560.68 – Immediate resistance
🚀 2,622.87 – Major resistance
🚀 2,730.73 – Long-term resistance
🟢 Key Support Zones (Below Current Price)
🔻 2,390.63 – Significant support
🔻 2,282.77 – Major support zone
🔻 2,220.58 – Strong historical support
📈 Candlestick Patterns
Recent Pattern: Strong bullish candle
🔥 Volume
Volume: 5.59M (compared to 2.95M, indicating strong participation and interest)
📊 Trend Analysis
Current Trend: Uptrend
Momentum Indicator: RSI Breakout
🚀 Conclusion
Mazagon Dock Shipbuilders Ltd is showing strong bullish momentum with a notable RSI breakout and an increase in volume, indicating robust participation. The stock is currently trending upwards, with key resistance levels in sight. Watch for price action near these resistance zones to gauge the sustainability of the trend.
Could Mazagon Dock sustain its rally and breach the next resistance levels, or will it encounter selling pressure that brings it back toward its support zones?

BUY MAZAGON DOCK SHIPBUILD LTD After split in last month stock was going through tight downside consolidation phase, now it is showing trend reversal with budget coming near with expectation of increase in DEFENCE EXPENDITURE. BUYING RANGE 2170-2200 WITH TARGET OF 2400,2700 AND FOLLOW STOPLOSS OF 1850.

MAZDOCK- PARABOLIC BULLISHNSE:MAZDOCK Weekly parabolic formation with accumulation and buying in data analytics of chartstory software. Location with accumulation may continue trend till 6000.

MazagonAll is well
Good day
Just my view and educational purposes only I'm not a SEBI registered advisory...trade on your own risk.
This is simple ORB Strategy with volume breakout..i will enter EOD 3.25pm if the price trade above the blue line and after entry I will wait for my target or stoploss (D candle should close below the red line) in valid if direct not triggered and closed below red line..
Just a view educational purposes only

MAZAGON DOCK SHIPBUIL LTD S/R Support and Resistance Levels:
Support Levels: These are price points (green line/shade) where a downward trend may be halted due to a concentration of buying interest. Imagine them as a safety net where buyers step in, preventing further decline.
Resistance Levels: Conversely, resistance levels (red line/shade) are where upward trends might stall due to increased selling interest. They act like a ceiling where sellers come in to push prices down.
Breakouts:
Bullish Breakout: When the price moves above resistance, it often indicates strong buying interest and the potential for a continued uptrend. Traders may view this as a signal to buy or hold.
Bearish Breakout: When the price falls below support, it can signal strong selling interest and the potential for a continued downtrend. Traders might see this as a cue to sell or avoid buying.
MA Ribbon (EMA 20, EMA 50, EMA 100, EMA 200) :
Above EMA: If the stock price is above the EMA, it suggests a potential uptrend or bullish momentum.
Below EMA: If the stock price is below the EMA, it indicates a potential downtrend or bearish momentum.
Trendline: A trendline is a straight line drawn on a chart to represent the general direction of a data point set.
Uptrend Line: Drawn by connecting the lows in an upward trend. Indicates that the price is moving higher over time. Acts as a support level, where prices tend to bounce upward.
Downtrend Line: Drawn by connecting the highs in a downward trend. Indicates that the price is moving lower over time. It acts as a resistance level, where prices tend to drop.
Disclaimer:
I am not a SEBI registered. The information provided here is for learning purposes only and should not be interpreted as financial advice. Consider the broader market context and consult with a qualified financial advisor before making investment decisions.

stock for swing MAZAGON DOCK SHIPBULL LTD
BUYING RANGE - 2315-2380
STOPLOSS-1890
TARGET - 2470-2550-2650
Mazagon Dock Shipbuilders Limited (MDL), Mumbai, established in 1774, is a prominent shipyard in India. Initially a small dry dock, MDL has evolved into a renowned shipbuilding company. It has constructed 801 vessels since 1960, including warships, submarines, cargo/passenger ships, and offshore platforms.


Sheer relative strength hereMazgaon in this weak market is showing tremendous strength. Govt initiates in shipping and maritime will yield good future results.
