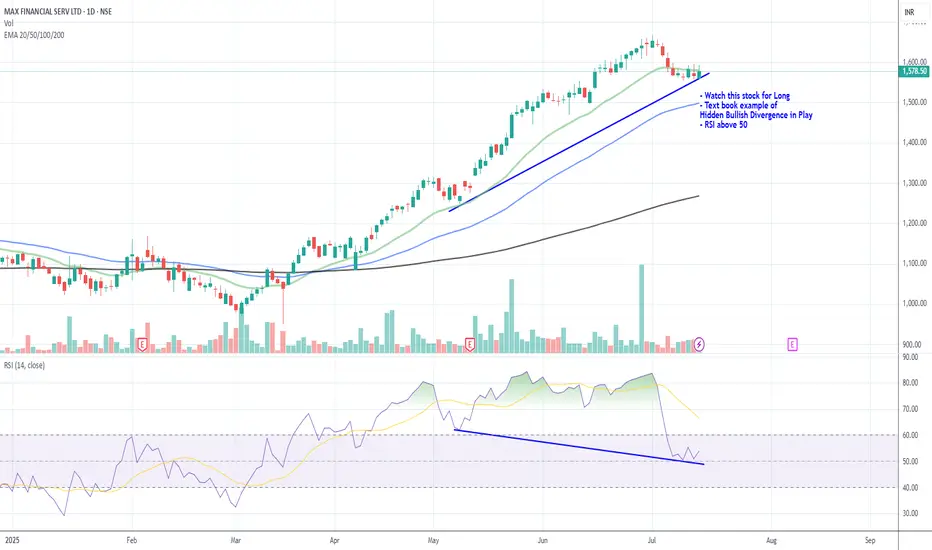
Watch MFSL for Long- Watch this stock for Long
- Text book example of
Hidden Bullish Divergence in Play
- RSI above 50
Next report date
—
Report period
—
EPS estimate
—
Revenue estimate
—
9.55 INR
3.27 B INR
464.97 B INR
261.28 M
About MAX FINANCIAL SERV LTD
Sector
Industry
Website
Headquarters
Noida
Founded
1988
ISIN
INE180A01020
FIGI
BBG000CW83C7
Max Financial Services Ltd. is engaged in the business of growing and nurturing business investments and providing management advisory services to group companies. It operates through the following segments: Business Investments, Life Insurance and others. The Business Investments segment deals with treasury investments. The Life Insurance segment offers private life insurance products and services. The company was founded by Analjit Singh on February 24, 1988 and is headquartered in Noida, India.
Related stocks
broking sector is bullish ?Broking sector is bullish as NSE listing is on news went thru some charts and mfsl gave me entry here definetly can go higher but I am happy wth 1:3

Cup and Handle break out in Max Financial ServicesIt seems like Max Financial Services Limited is breaking the resistance line of the cup and handle pattern, that it has been forming for the last 3 years. A breakout from the resistance trendline can drive the stock to 1700 and 2000 targets, as indicated by the pattern.

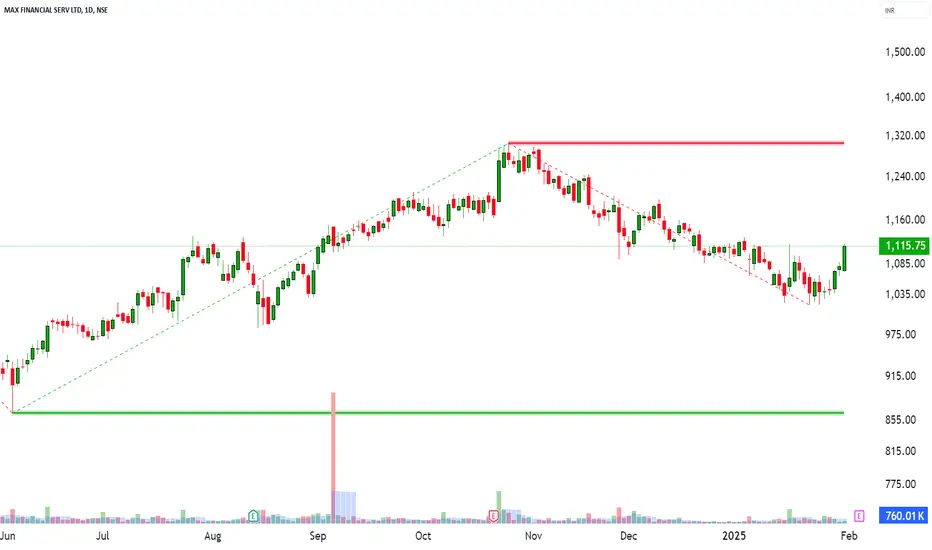
MFSL: Cup & HandleStock has given a breakout of Cup & Handle pattern and retested the neckline in Jan'25. The measured target for the same is coming in the region of 1900. On the downside the key level can be 1080.

Stock Analysis – Max Financial Services Ltd (MFSL)📅 Date: January 30, 2025
📊 Timeframe: Daily Chart
📌 Market Snapshot
🔹 Change: +34.15 points (+3.16%)
🔹 Volume: 331.73K (Below 20-day avg: 727.74K)(Keep a watch on volume)
🔹 Momentum Indicator: RSI breakout, EMA 200 Crossover
🔹 Strong Bullish Candle (Bullish Marubozu) forming
⚡ Levels to Watch
🔴 K
Multi Year Breakout on MFSLMFSL has given a multi year breakout after 3 plus years of consolidation.
Price has tested the level and we need to wait for the Weekly Candle close to be Bullish without any selling pressure to confirm this.
We can expect an upside target of 2000 level on this stock in the times ahead.
A buy on di

MAX FINANCIAL SERVICE S/R Support and Resistance Levels:
Support Levels: These are price points (green line/shade) where a downward trend may be halted due to a concentration of buying interest. Imagine them as a safety net where buyers step in, preventing further decline.
Resistance Levels: Conversely, resistance levels (re

SWING TUTORIAL - MFSLIn this tutorial, we analyze the stock NSE:MFSL (MAX FINANCIAL SERV LTD) identifying a lucrative swing trading opportunity following its all-time high in July 2021. The stock declined by nearly 50%, forming a Lower Low Price Action Pattern, but subsequently reversed its trend.
At the same time, w

Multiyear (3 Year) #BreakoutStock- Potential Upside 60-70%
- Monthly Breakout
- Volume Pop
- Recreating History
Like & Retweet to have your support🙌&❤️

Max Financial view for Intraday 24th September #MFSL Max Financial view for Intraday 24th September #MFSL
Buying may witness above 1205
Support area 1184-1185. Below ignoring buying momentum for intraday
Selling may witness below 1184
Resistance area 1200-1205
Above ignoring selling momentum for intraday
Charts for Educational purposes only.
Pleas

See all ideas
Summarizing what the indicators are suggesting.
Neutral
SellBuy
Strong sellStrong buy
Strong sellSellNeutralBuyStrong buy
Neutral
SellBuy
Strong sellStrong buy
Strong sellSellNeutralBuyStrong buy
Neutral
SellBuy
Strong sellStrong buy
Strong sellSellNeutralBuyStrong buy
An aggregate view of professional's ratings.
Neutral
SellBuy
Strong sellStrong buy
Strong sellSellNeutralBuyStrong buy
Neutral
SellBuy
Strong sellStrong buy
Strong sellSellNeutralBuyStrong buy
Neutral
SellBuy
Strong sellStrong buy
Strong sellSellNeutralBuyStrong buy
Displays a symbol's price movements over previous years to identify recurring trends.
Frequently Asked Questions
The current price of MFSL is 1,526.70 INR — it has increased by 0.06% in the past 24 hours. Watch MAX FINANCIAL SERV LTD stock price performance more closely on the chart.
Depending on the exchange, the stock ticker may vary. For instance, on NSE exchange MAX FINANCIAL SERV LTD stocks are traded under the ticker MFSL.
MFSL stock has fallen by −0.21% compared to the previous week, the month change is a −5.67% fall, over the last year MAX FINANCIAL SERV LTD has showed a 40.06% increase.
We've gathered analysts' opinions on MAX FINANCIAL SERV LTD future price: according to them, MFSL price has a max estimate of 2,000.00 INR and a min estimate of 1,400.00 INR. Watch MFSL chart and read a more detailed MAX FINANCIAL SERV LTD stock forecast: see what analysts think of MAX FINANCIAL SERV LTD and suggest that you do with its stocks.
MFSL reached its all-time high on Jul 1, 2025 with the price of 1,666.90 INR, and its all-time low was 80.00 INR and was reached on Oct 24, 2008. View more price dynamics on MFSL chart.
See other stocks reaching their highest and lowest prices.
See other stocks reaching their highest and lowest prices.
MFSL stock is 1.25% volatile and has beta coefficient of 0.81. Track MAX FINANCIAL SERV LTD stock price on the chart and check out the list of the most volatile stocks — is MAX FINANCIAL SERV LTD there?
Today MAX FINANCIAL SERV LTD has the market capitalization of 527.06 B, it has decreased by −0.80% over the last week.
Yes, you can track MAX FINANCIAL SERV LTD financials in yearly and quarterly reports right on TradingView.
MAX FINANCIAL SERV LTD is going to release the next earnings report on Aug 7, 2025. Keep track of upcoming events with our Earnings Calendar.
MFSL earnings for the last quarter are 1.53 INR per share, whereas the estimation was 3.69 INR resulting in a −58.42% surprise. The estimated earnings for the next quarter are 2.90 INR per share. See more details about MAX FINANCIAL SERV LTD earnings.
MAX FINANCIAL SERV LTD revenue for the last quarter amounts to 118.63 B INR, despite the estimated figure of 123.09 B INR. In the next quarter, revenue is expected to reach 62.96 B INR.
MFSL net income for the last quarter is 313.10 M INR, while the quarter before that showed 560.40 M INR of net income which accounts for −44.13% change. Track more MAX FINANCIAL SERV LTD financial stats to get the full picture.
No, MFSL doesn't pay any dividends to its shareholders. But don't worry, we've prepared a list of high-dividend stocks for you.
EBITDA measures a company's operating performance, its growth signifies an improvement in the efficiency of a company. MAX FINANCIAL SERV LTD EBITDA is 6.85 B INR, and current EBITDA margin is 1.48%. See more stats in MAX FINANCIAL SERV LTD financial statements.
Like other stocks, MFSL shares are traded on stock exchanges, e.g. Nasdaq, Nyse, Euronext, and the easiest way to buy them is through an online stock broker. To do this, you need to open an account and follow a broker's procedures, then start trading. You can trade MAX FINANCIAL SERV LTD stock right from TradingView charts — choose your broker and connect to your account.
Investing in stocks requires a comprehensive research: you should carefully study all the available data, e.g. company's financials, related news, and its technical analysis. So MAX FINANCIAL SERV LTD technincal analysis shows the sell today, and its 1 week rating is buy. Since market conditions are prone to changes, it's worth looking a bit further into the future — according to the 1 month rating MAX FINANCIAL SERV LTD stock shows the buy signal. See more of MAX FINANCIAL SERV LTD technicals for a more comprehensive analysis.
If you're still not sure, try looking for inspiration in our curated watchlists.
If you're still not sure, try looking for inspiration in our curated watchlists.