MIDHANI READY TO GOMisra Dhatu Nigam Limited, it has completed its setup and ready to go above this orange line.
Next report date
—
Report period
—
EPS estimate
—
Revenue estimate
—
5.90 INR
1.11 B INR
10.74 B INR
48.71 M
About MISHRA DHATU NIGAM LTD
Sector
Industry
CEO
S.V.S. Narayana Murty
Website
Headquarters
Hyderabad
Founded
1973
ISIN
INE099Z01011
FIGI
BBG00GM41QZ4
Mishra Dhatu Nigam Ltd. engages in the manufacturing of steel, superalloys and titanium alloys. It also offers special steel, electrical and electronic alloy, molybdenum, special weld consumables, magnesium alloys, titanium tubes, fastners, titanium castings, columbium alloy, biomedical products, armour products, and moly products. The company was founded on November 20, 1973 and is headquartered in Hyderabad, India.
Related stocks
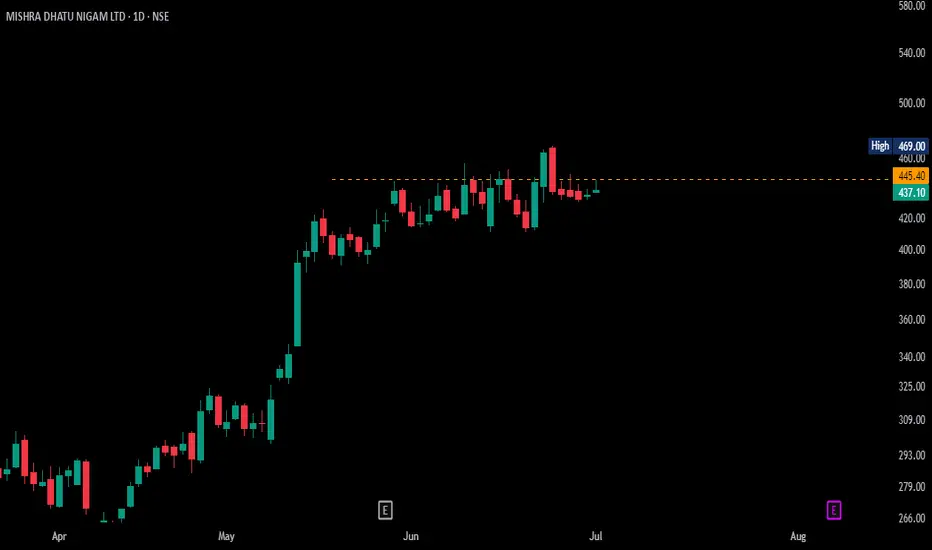
Mishradhatu nigam tgt is 540 for positionl as per my view midhani buy at 395 level, and this is already entry done, now wait for tgt 540 for positional, you can buy above closing 440 tgt is 465 for 2,3days, for more profit hold till 540, positional tgt

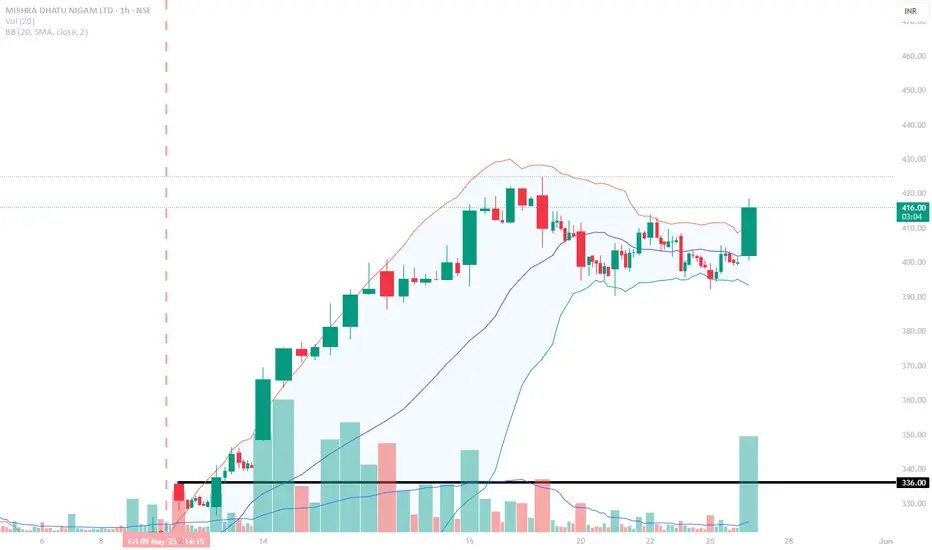
Midhani Ready for Blast!Midhani is in a strong uptrend on the daily time frame, consistently forming higher highs and higher lows. On the lower time frame, the stock had cooled off but has now resumed its upward move, breaking out of a falling trendline on strong volumes. The current setup offers a risk of around 6 per cen
MIDHANI - BOTTOM FISHINGNSE:MIDHANI Weekly chart showing exact location at 4 years of moving average with bullish formation double bottom.

Mishra Dhatun LTDThe company caters to Military Equipments and Its a long Term hold so we should look to buy into this. Overall the company has a long journey to fill can it be a next BDL

MIDHANIHi guys,
In this chart i Found a Demand Zone in MIDHANI CHART for Positional entry,
Observed these Levels based on price action and Demand & Supply.
*Don't Take any trades based on this Picture.
... because this chart is for educational purpose only not for Buy or Sell Recommendation..

MIDHANI is Good 370 buy MIDHANI is Good 370 buy good level
Is good BTST Good
Weekly Breakout
level Study and buy
only for
Education purpose

Mishra Dhatu Nigam Trend Analysis3rd wave of higher degree Wave III can start anytime soon.
Good to buy above 351 with Stop loss around 310 for the following targets
Target 1 : 1450 (310% ROI)
Target 2 : 2300 (550% ROI)
Do your own due diligence before taking any action.
Peace!!

Mishra Dhatu Nigam Ltd.*Mishra Dhatu Nigam Ltd.*
P&F Formation on Yearly Basis.
Price BreakOut Needed & Sustained. Then good to go.
Strong Vol Consolidation. Continued Traction Needed.
Metals Index: Positive Outlook
RSI: 1H>D>W<M
*Trail SL with Upside*
*Book Profit as per Risk Appetite*
*This is an Opinion. Do your own

See all ideas
Summarizing what the indicators are suggesting.
Oscillators
Neutral
SellBuy
Strong sellStrong buy
Strong sellSellNeutralBuyStrong buy
Oscillators
Neutral
SellBuy
Strong sellStrong buy
Strong sellSellNeutralBuyStrong buy
Summary
Neutral
SellBuy
Strong sellStrong buy
Strong sellSellNeutralBuyStrong buy
Summary
Neutral
SellBuy
Strong sellStrong buy
Strong sellSellNeutralBuyStrong buy
Summary
Neutral
SellBuy
Strong sellStrong buy
Strong sellSellNeutralBuyStrong buy
Moving Averages
Neutral
SellBuy
Strong sellStrong buy
Strong sellSellNeutralBuyStrong buy
Moving Averages
Neutral
SellBuy
Strong sellStrong buy
Strong sellSellNeutralBuyStrong buy
Displays a symbol's price movements over previous years to identify recurring trends.
Frequently Asked Questions
The current price of MIDHANI is 384.55 INR — it has decreased by −1.81% in the past 24 hours. Watch MISHRA DHATU NIGAM LTD stock price performance more closely on the chart.
Depending on the exchange, the stock ticker may vary. For instance, on NSE exchange MISHRA DHATU NIGAM LTD stocks are traded under the ticker MIDHANI.
MIDHANI stock has fallen by −2.60% compared to the previous week, the month change is a −8.87% fall, over the last year MISHRA DHATU NIGAM LTD has showed a −14.18% decrease.
MIDHANI reached its all-time high on Feb 5, 2024 with the price of 547.50 INR, and its all-time low was 86.05 INR and was reached on Apr 4, 2018. View more price dynamics on MIDHANI chart.
See other stocks reaching their highest and lowest prices.
See other stocks reaching their highest and lowest prices.
MIDHANI stock is 2.95% volatile and has beta coefficient of 2.06. Track MISHRA DHATU NIGAM LTD stock price on the chart and check out the list of the most volatile stocks — is MISHRA DHATU NIGAM LTD there?
Today MISHRA DHATU NIGAM LTD has the market capitalization of 72.06 B, it has increased by 1.88% over the last week.
Yes, you can track MISHRA DHATU NIGAM LTD financials in yearly and quarterly reports right on TradingView.
MISHRA DHATU NIGAM LTD is going to release the next earnings report on Aug 13, 2025. Keep track of upcoming events with our Earnings Calendar.
MIDHANI net income for the last quarter is 562.00 M INR, while the quarter before that showed 255.24 M INR of net income which accounts for 120.18% change. Track more MISHRA DHATU NIGAM LTD financial stats to get the full picture.
EBITDA measures a company's operating performance, its growth signifies an improvement in the efficiency of a company. MISHRA DHATU NIGAM LTD EBITDA is 2.18 B INR, and current EBITDA margin is 20.30%. See more stats in MISHRA DHATU NIGAM LTD financial statements.
Like other stocks, MIDHANI shares are traded on stock exchanges, e.g. Nasdaq, Nyse, Euronext, and the easiest way to buy them is through an online stock broker. To do this, you need to open an account and follow a broker's procedures, then start trading. You can trade MISHRA DHATU NIGAM LTD stock right from TradingView charts — choose your broker and connect to your account.
Investing in stocks requires a comprehensive research: you should carefully study all the available data, e.g. company's financials, related news, and its technical analysis. So MISHRA DHATU NIGAM LTD technincal analysis shows the sell today, and its 1 week rating is neutral. Since market conditions are prone to changes, it's worth looking a bit further into the future — according to the 1 month rating MISHRA DHATU NIGAM LTD stock shows the buy signal. See more of MISHRA DHATU NIGAM LTD technicals for a more comprehensive analysis.
If you're still not sure, try looking for inspiration in our curated watchlists.
If you're still not sure, try looking for inspiration in our curated watchlists.