MINDACORPNSE:MINDACORP
Note :
1. One should go long with a Stop Loss, below the Trendline or the Previous Swing Low.
2. Risk :Reward ratio should be minimum 1:2.
3. Plan your trade as per the Money Management and Risk Appetite.
Disclaimer :
>You are responsible for your profits and loss.
>The idea shared here is purely for Educational purpose.
>Follow back, for more ideas and their notifications on your email.
>Support and Like incase the idea works for you.
MINDACORP trade ideas

Trendline Support - MINDACORPCurrent Price: ₹550
Technical Analysis:
Trendline Pattern Support taken: The chart indicates that the stock has taken support from a trendline. This is generally a bullish sign, suggesting that the price has found a floor and could potentially rebound or continue its upward trajectory. The chart shows a clear uptrend line with several points of support.
Target: Double or Multibagger stock: This is an ambitious long-term target, implying a significant increase in the stock price.
Time Frame: 1 Year to 3 Year (This indicates a medium to long-term investment horizon for this target).
Fundamental Analysis :
Market Cap: ₹13,152 Cr.
Stock P/E: 51.5 (This is a premium valuation, higher than the industry average, indicating market expectations of future growth).
Book Value: ₹87.9
Face Value: ₹2.00
Sales (Revenue from Operations): Consistently growing, from ₹1,590 Cr in Mar 2014 to ₹5,056 Cr in Mar 2025.
Operating Profit: Generally increasing, from ₹127 Cr in Mar 2014 to ₹575 Cr in Mar 2025.
Net Profit: Shows consistent growth, from ₹79 Cr in Mar 2014 to ₹255 Cr in Mar 2025.
EPS in Rs.: Increased from ₹3.79 in Mar 2014 to ₹10.68 in Mar 2025.
Compounded Sales Growth: 1 Year: 9%, 3 Years: 19%, 5 Years: 18%, 10 Years: 10%.
Compounded Profit Growth: 1 Year: 12%, 3 Years: 15%, 5 Years: 27%, 10 Years: 11%.
Return on Equity: Last Year: 16%, 3 Years: 15%, 5 Years: 14%, 10 Years: 12%.
Corporate Actions:
Dividend: The Dividend Payout % has varied but has been consistently paid, with a 10% payout in Mar 2025.
Recent News: Any news regarding new client wins, expansion plans (especially related to electric vehicles or advanced automotive technologies), or strategic partnerships would be relevant for Minda Corporation, a leading automotive components manufacturer.
Overall Assessment:
Minda Corporation presents a mixed but potentially bullish picture:
Technical Strength: The stock has taken Trendline Support, suggesting technical strength and a potential continuation of its upward trajectory as seen on the chart. The stock is in a clear long-term uptrend.
Consistent Growth: The company has demonstrated consistent growth in Sales, Operating Profit, and Net Profit over the long term (10 years, 5 years, 3 years), which is a significant positive.
Healthy Financials: Low Debt to Equity (0.25), strong ROCE (16.0%), and ROE (12.9%) indicate good financial health and efficient management.
Valuation: The Stock P/E of 51.5 is significantly higher than the Industry P/E of 26.9. This premium valuation suggests that the market has high expectations for Minda Corp's future growth, likely driven by its position in the evolving automotive sector (e.g., EV components).
The target of being a "Double or Multibagger" stock within a 1 to 3-year timeframe is ambitious but potentially achievable for a company with strong long-term growth and a premium valuation if it continues to deliver on market expectations and capitalize on industry trends (like the shift to EVs).
Disclaimer: This analysis is for informational purposes only and does not constitute investment advice. Always conduct your own thorough research, carefully analyze the stock chart for the specific trendline support, assess your risk tolerance, and consult with a qualified financial advisor before making any investment decisions. The stock market carries inherent risks.

Buy Minda corp at 576. Target 1500.Multibagger Buy Minda corporation ltd at 576-555.
long ter target 1500-2000.
only buy if u can digest 40% correction in future .

Minda corporationMind is in sideways, and it forms a zigzag pattern on day closing basis we can put stoploss 459 and try to buy it around 492 to 480 for tgt 652 plus

[Swing Buy] MINDACORP CMP 525 ; BO level - 560 around.Analysis:
Pattern Formation:
The chart shows three distinct lows at approximately the same price level, confirming the triple bottom pattern.
This pattern is a bullish reversal indicator, suggesting that the stock might be moving upward after breaking out from its resistance level.
Breakout Zone:
The upper blue line acts as the resistance zone.
A breakout above this level with significant volume would confirm the pattern and indicate a potential upward rally.
I may enter once the following are satisfied..
Consider entering after a confirmed breakout above the resistance level (upper blue line), ideally with a volume spike.
Moving averages and price action also indicate positive momentum.
This is for education purpose..do your own research if you want to enter :)

Minda Corporation looking upside in weekly time frameMinda Corporation looking upside in weekly time frame cmp @521 on 01 jan 2025 .... will see the result ...

MINDA CORPORATION LTD S/R Support and Resistance Levels:
Support Levels: These are price points (green line/shade) where a downward trend may be halted due to a concentration of buying interest. Imagine them as a safety net where buyers step in, preventing further decline.
Resistance Levels: Conversely, resistance levels (red line/shade) are where upward trends might stall due to increased selling interest. They act like a ceiling where sellers come in to push prices down.
Breakouts:
Bullish Breakout: When the price moves above resistance, it often indicates strong buying interest and the potential for a continued uptrend. Traders may view this as a signal to buy or hold.
Bearish Breakout: When the price falls below support, it can signal strong selling interest and the potential for a continued downtrend. Traders might see this as a cue to sell or avoid buying.
MA Ribbon (EMA 20, EMA 50, EMA 100, EMA 200) :
Above EMA: If the stock price is above the EMA, it suggests a potential uptrend or bullish momentum.
Below EMA: If the stock price is below the EMA, it indicates a potential downtrend or bearish momentum.
Trendline: A trendline is a straight line drawn on a chart to represent the general direction of a data point set.
Uptrend Line: Drawn by connecting the lows in an upward trend. Indicates that the price is moving higher over time. Acts as a support level, where prices tend to bounce upward.
Downtrend Line: Drawn by connecting the highs in a downward trend. Indicates that the price is moving lower over time. It acts as a resistance level, where prices tend to drop.
Disclaimer:
I am not a SEBI registered. The information provided here is for learning purposes only and should not be interpreted as financial advice. Consider the broader market context and consult with a qualified financial advisor before making investment decisions.

MINDA CORP 61% retrace with Decrease in volumeHello Everyone,
Minda Corp Trading at 494 after making lifetime high oe 645 its retrace fibbo 61% also trading at EMA 200 levels at daily timeframe, Decrease in price with decrease in volume wit RSI oversold and Positive divergence goood long set up possibility for swing as well as positional.

minda corporation buy trade Entry point :- 580.50
Stop lose :- 499.30
Risk 1% of capital
Target 1 :- 699.95
Target 2 :- 758.85
Target 3 :- 848.65

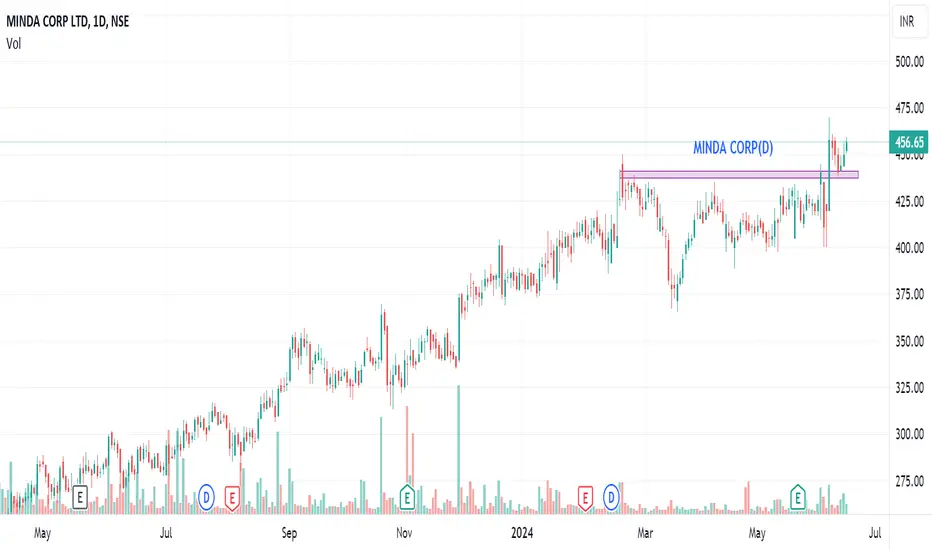
MINDA CORP - Gearing up for More Upside ?After almost two months of side ways move the stock is on the verge of taking out the previous Price Rejection Zone. My checklist all ticked right
Relative Strength
Buying Pressure
Increased volume
Money Flow
Absolute Momentum
Increased Delivery volumes
There is a high probability of the stock moving into the next Higher trajectory. A positive close above 527 will add more conviction.

MINDACORP BRAKEOUT ON DAILY CHARTNSE:MINDACORP
MindaCorp gives brake out on daily chart.
I am buying this stock
Near 510
And follow sl on 440
My target will be 640
My risk reward ratio is 1:2
Return on capital 25%+

Long entry on Minda corp above 497Can try for long entry , RSI reaching 70 now, a dip towards 485 can be bought target 505, 510, 515 . Stop loss 460 on daily closing basis( or one hour candle close)
Duration 5 trading days
Piotroski Score 8
Strength
Strong Momentum: Price above short, medium and long term moving averages
New 52 week high today
Growth in Net Profit with increasing Profit Margin (QoQ)
Company with Low Debt
Company able to generate Net Cash - Improving Net Cash Flow for last 2 years
Book Value per share Improving for last 2 years
Company with Zero Promoter Pledge
FII / FPI or Institutions increasing their shareholding
Opportunities
Positive Breakout Third Resistance ( LTP > R3)
Brokers upgraded recommendation or target price in the past three months
Negative to Positive growth in Sales and Profit with Strong Price momentum
RSI indicating price strength
Threats
High PE (PE > 40)
Increasing Trend in Non-Core Income
www.tradingview.com
Safe Entry above 497 on 15 minute candle close
Standard Disclaimer : Not a Sebi registered analyst. Consult your financial advisor before investing.

EXPECTED IMPORTANT DIRECTIONAL LEVELS FOR THE YEAR Hey Folks..!
I have marked all the important directional level for this year.
All the levels have the description, Bullish movements is expected in bullish range and Downside is expected in the bearish range.
Use the levels either Standalone or Club these levels with your existing trading style & strategy it will surely give you an edge.
If in case at any point of time MINDA CORP NSE:MINDACORP goes beyond these levels then i will either post additional levels in as an update or i will republish the idea with more levels.
Rules are simple , Short trades can work well in the Red / Bearish ranges whereas Long trades can work well in the Bullish ranges / Green ranges.
All the Best Folks ! Stay tuned for updates.

IMPORTANT POSITIONAL LEVELS FOR INVESTORSHey Folks..! Hope you all had a great year and i wish you have a wonderful year ahead...
I have marked all the profit booking levels for the year, anyone who is holding any positions should be cautions at these levels...
In case you have a bullish view that treat these levels as a further breakout levels...
This analysis is my personal opinion and do not consider as an investment advice.

Resistance BreakoutPlease look into the chart for a detailed understanding.
Consider these for short-term & swing trades with 2% profit.
For BTST trades consider booking
target for 1% - 2%
For long-term trades look out for resistance drawn above closing.
Please consider these ideas for educational purpose
Please note that, if there are some big targets, those are drawn thinking for long term.

Trend line breakout manufacture and supply over 20 categories of automotive components and systems to leading Indian and international OEMs based in India, Asia, South and North America and Europe
1) resistance line breakout
2) keeping Stop loss of 295
3) getting towards life time High level
4) risk reward super
5) please take own decision for buy and sell
6) I'm a learner just sharing my knowledge

MINDA CORP any time reached on sky with high fly MINDA CORP is on ready to given breakout with high volume now price is 287 trh 310/330/340 sl 278 for short term
long term above 302 trg 340/380/420 and above sl 278

Minda Corporation-Nice breakout.Minda Corporation-Nice breakout.
Capital to be deployed- 20k
Price - 272
Stoploss-238
Targets -359
#mindacorporation #nifty50 #NiftyBank #investment #StockMarket #StocksToBuy

Analysis of Minda Corp: Potential Multibagger of Auto Ancillary
Minda Corp, an auto ancillary company, has shown significant potential for future growth and investment. The stock recently broke out of a long-standing consolidation zone, forming a Cup with Handle pattern on the monthly timeframe. This bullish technical formation has sparked interest among investors.
After trading within a consolidation zone for the past five years, Minda Corp experienced a breakout in April, signaling a potential shift in the stock's trajectory. The formation of a Cup with Handle pattern further strengthens the bullish case for the stock. This breakout suggests the end of a consolidation phase and presents opportunities for further price appreciation.
Minda Corp encountered some profit booking in the recent month, but it appears that the stock has absorbed this impulsive move and is now poised for its next bullish run. This consolidation period can be viewed as a healthy correction, offering investors an entry point into the market.
On the last Friday, Minda Corp displayed a significant bullish candle, closing 5.48% higher than the previous day. This surge was accompanied by substantial trading volume, with 3.8 million shares traded, representing a 219% increase compared to the 10-day average volume. Such a surge in buying interest indicates renewed market confidence and potential upward momentum.
Minda Corp currently trades at a price-to-earnings (P/E) ratio of around 25, slightly above the median P/E of 22 observed over the past five years. While this suggests an optimistic outlook among investors.
Minda Corp recently published its quarterly results, revealing a YoY increase in sales of 13%. This positive indicator reflects the company's growth potential.
For investors considering a position in Minda Corp, a potential long entry could be initiated around the 295-300 price range, with a strict stop-loss level set at 274, representing an 8% downside risk while The projected price targets for the midterm period are 350, 390, and 450. However, these targets should be evaluated in the context of prevailing market conditions and the company's overall performance.

MINDACORP (W) - CONSOLIDATION NEAR THE BO ZONEHH's And HL's pattern is seen near the breakout zone.
Target 1: 335
Target 2: 395
SL: 260

Mindacorp symmetric triangle breakoutCMP 247.75
- Strong Momentum: Price above short, medium and long term moving averages
- Showing price strength
- Bullish momentum
- May hit 270-280 in short term
*Not recommendation. Do your due diligence

MINDA CORPORATIONHey traders this the weekly chart of Minda Coporation wher this stock is givinf brekout of trendline which is important as support line and near swing low 188 zone can be next support so NO Buying view.
