MOTILAL OSWALThis stock breakout ATH resistance level and some of consolidation level breakout in D TF and TGT will be upto 40%
this is only for educational purpose
MOTILALOFS trade ideas

MotilalOswal ShortTerm LongDate : 27-01-2024
Buy MotilalOswal @ CMP
for the Target of 2027-2534
SL 1145
Strategy : SBO + RSI > 60 + EMA above 50 & 100
Volume Built-up
Duration few Days

Motilal Oswal is Ready to Me the Next Move
Broken out of Downtrending Slope.
Relative Strength is Positive
Making HHs and HLs as per Dow Theory
Amazing Q1 Results
Volume Analysis shows Huge Buying Interest

#MOTILALA MULTIYEAR BREAKOUTmotilal loking gud on chart for trade you must analyse i mark the level in the chart for good move my analysisi only for study purpose.


MOTILAL OSWAL LONGBreaking and sustaining above weekly trendline with good volume, Weekly RSI is also showing strength... Can go above the target but I will update if to hold further or not. Seeing an upside till 746 with a SL of 644. I am not a SEBI Reg. Analyst, do your own research before investing. Comment if you have any regarding this :)


MOTILALOFS - Has held above 600 even though volume droppedThis was after supply emerged near 900 after high volume markup from 600 from May'21-Jul'21
Plan -
to Purchase Breakout above 900
or, rejection indications below 600
PB 1x
PE 8x
DE 0.6x
ROCE 8%
Div 2%

# SHROT # MOTILAL OSWAL FINA# SHROT
# MOTILAL OSWAL FINA
mark-previous day low, when ever its break-down with strong 5min breaish candle _ take entry
Condition - near-by flat opening

Motilal Oswal is becoming a long term investment idea. Motilal Oswal is looking strong in the falling market and can be a good investment in the long term considering the promoters themselves are trying to increase the stake. Motilal Oswal is a company with Zero Promoter pledge where MFs and FIIs are increasing the stake. Net profit of the company is also increasing. Fresh entry above 895 closing will be good for long term investment. Targets will be 958 and 1014. Stop loss should be maintained at closing below 800.

Awaiting Symmetrical Triangle BreakoutAs you can see, the price action has formed lower highs and higher lows in NSE:MOTILALOFS . The volatility has also dropped massively. The RSI (9) in Hilega_Milega is having higher lows and equal highs, showing the strength is ramping up. The target out of this breakout is 1075, however, it may break down.
ENTRY position @ Breakout with strong momentum crossing up above VOLUME PROFILE POINT OF CONTROL
Hello Trader. Above is purely my opinion. It doesn't mean that you need to trade accordingly. Please note that I'm not Sebi registered advisor or technical analyst . Trade on your own conviction and please consult your advisor before investing . If you like the idea, do not forget to support with a like and follow.

Moilal Oswal Financial Service LimitedMotilal Oswal has given a symentric triangle breakout. On an effect of financial sector and banking sector's upward movement. it has potential to rise.
MOTILALOFS - short term tradeDear All,
Kindly find the flag pattern formed on daily time frame
Read the chart well and take your trades accordingly.
R1 953
R2 965
R3 986
S1 920
S2 900
S3 887
Entry above 940 levels preferably 950
Target 1 960
Target 2 1000
SL to be as per your risk appetite.


Looking good on chartsRS Positive RSI Positive Bounced from 50 EMA Support and trending upwards. Seems it must go up in the near term. Please note that I am not SEBI registered so please take your investment decisions on your own convinced perceptions.

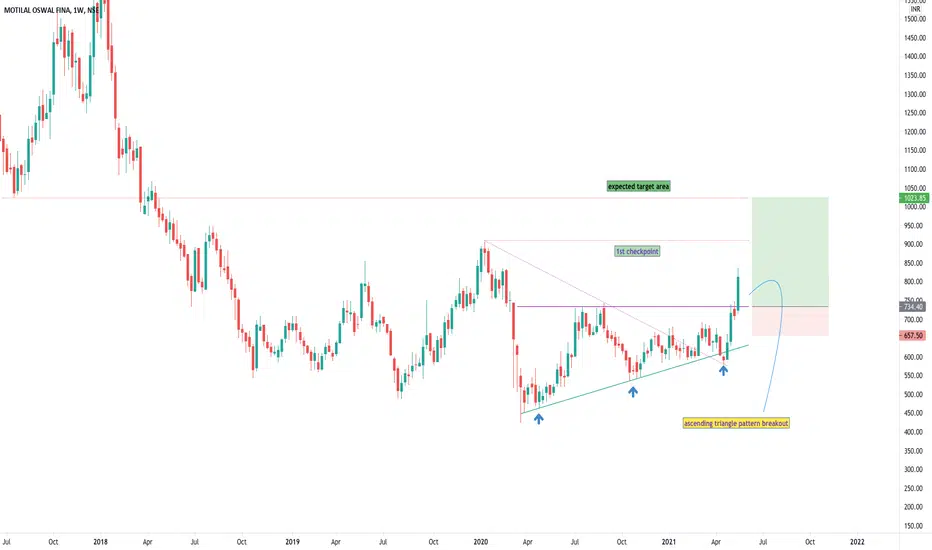
BUY CALLA good buying opportunity seen in Motilala Fin .Because it gave breakout on ascending triangle pattern.For more this type of calls join with me in my charting analysis.

Motilal Oswal Fin BreakoutMOTILALOFS broken resistance of ~897 with good volume.
RS is positive above 0.
Sector also turning bullish.
This can give good upside move of 25-30%.

Swing Trading -Motilal OswalSwing opportunity in Motilal Oswal
A complete analysis
(Only for educational purposes, not a trading advice, as I am not a SEBI registered analyst.)

MOTILAL Oswal Finance - Buy after Breakout Looking bullish.
Disclaimer: Don't just blindly Trade or Invest, learn and then trade. Manage your risks properly.
This analysis is purely for EDUCATIONAL purpose


MOTILALOFS - FIB levels, Trendline and Pattern Study 19-Sep21MOTILALOFS - (On-Watch)
---------------------------------
Option 1 -- BULLISH if, Triangle pattern breaks out and
then, a close above 835 and 860 is seen..
Option 2 -- BEARISH if, Triangle pattern breaks down and
then, a close below 755 and 725 is seen.
Technicals:
---------------
- Long term UP trend is intact (Green Line).
- Symmetrical triangle for >1 month (In-Decision?? or Continuation??)..
- On 13-Sep21 , there was a confluence of :
:: Price making a HL after ~2months of correction.
:: FIB 61.8 level being held
:: price bouncing from short-term (Yellow) Trendline.
Fundamentals:
------------------
- Very Cheap valuation ( pls comment if you know why??).
- Current TTM EPS is the highest ever.
Approach (Cat on the Wall):
----------------------------------
A Cat on the wall is never ever confused on how to jump.. But which side to jump.
And it always chooses the most favorable and less riskier side.

MOTILAL OSWAL 15MINMOTILAL OSWAL 15MIN is good to buy now. Its down almost 30% in 1 month and now taken support from the recent times strong support in a 60MIN. Can buy for short to medium term also.

MOTILAL OSWAL FINABuying level stock
Previous high is now acting as a support
Do your own analysis before investing
Price action trading
